-
Hi Guest!
The costs of running this forum are covered by Sea Lion Press. If you'd like to help support the company and the forum, visit patreon.com/sealionpress
You are using an out of date browser. It may not display this or other websites correctly.
You should upgrade or use an alternative browser.
You should upgrade or use an alternative browser.
Canada-United States Election Conversions
- Thread starter Thande
- Start date
Dan1988
DO! YOU! HEAR THE SONG OF PEACE!
- Location
- North America
- Pronouns
- he/him
That's some nice work you did for 2008, @Thande, and at least it looks pretty close to what actually happened in 2008 (the first election I saw when at uni). As for concerns for our Western Canadian equivalents that there may not be enough variation and all that - don't worry about it! As you and I well know, the strong results of the Tories and all that actually reflected what happened in Canada at that time (though I do find it interesting what would happen combining the results for the NWT and Nunavut). The results seem about right, especially if one drops any preconceptions based on OTL. We'd have to find reasons that would explain some of the anomalies - in New Mexico's case, probably because the local Tories did a good job reaching out to the Hispanic community, for example. Or in the case of the three BC-esque states, where we have what Colin Woodard in his book American Nations calls the split between the "Left Coast" and the "Far West", we'll have to analyze the BC results and see what happened, and/or we can say that every coastal community is like Orange County. Some definite fruits for analysis for those who want to over-think things. As for the Grits and Rhode Island - I don't know about what actually happened in PEI, but in RI's case I see it as OTL finally spilling over, at least in terms of the Democratic dominance here (with all the problems and corruption it entails), and that's despite a GOP governor in Carcieri - who, despite he being the one behind the genesis of the 38 Studios scandal and the so-called "Big Audit" that was supposed to find government waste left and right but didn't, was actually very close to the traditional New England Republican worldview. Now, if you really want something that would raise eyebrows in both Canada and the UK, not to mention the US, how about having a former PM representing his disgraced successor in a series of legal cases (cf. http://www.providencejournal.com/article/20140416/NEWS/304169947 ) - when that same former PM replaced someone with a pre-MeToo harrassment problem (cf. http://www.foxnews.com/story/2002/09/20/ri-house-speaker-post-threatened.html - yes, it's Fox News, but here it's a strict quotation from the AP, and I remember the local media here going nuts over John Harwood's downfall). Madness? THIS. IS. RHODE ISLAND!!!
- Location
- Auckland via London
- Pronouns
- He/him
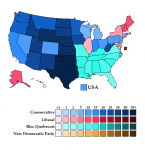
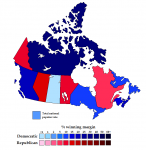
Here's the 2012 US election projected onto Canada. A very close result in Saskatchewan there. I'll do the other way around another time.
View attachment 2387
This map actually looks like the American flag. Just add a few stars in the north.
Right, now to do Canada 2011 using US 2012 data and the same methodology as above.
Alberta
Kansas
Con 71.4%
NDP 16.1%
Lib 9.0%
Grn 0.7%
Oth 2.8%
New Mexico
Con 55.5%
NDP 24.3%
Lib 13.6%
Grn 1.4%
Oth 5.2%
Oklahoma
Con 78.5%
NDP 13.8%
Lib 7.7%
(Grn & Oth 0%)
Texas
Con 69.8%
NDP 17.9%
Lib 10.0%
Grn 0.5%
Oth 1.8%
Shame the Lib/NDP balance is necessarily the same everywhere due to the methodology--instinctively one might imagine the Liberals still ahead of the NDP in NM, but that's perhaps stretching it too far.
British Columbia
California
Con 44.5%
NDP 33.5%
Lib 13.8%
Grn 7.3%
Oth 0.8%
Oregon
Con 48.7%
NDP 29.1%
Lib 12.0%
Grn 9.2%
Oth 1.0%
Washington
Con 48.1%
NDP 30.4%
Lib 12.5%
Grn 8.2%
Oth 0.9%
Tories still winning places one probably wouldn't expect, but the NDP now clearly the rising opposition force!...so obviously the Liberals would go on to win here in 2015 because CANADA.
Manitoba
Arizona
Con 53.2%
NDP 26.4%
Lib 17.0%
Grn 3.0%
Oth 0.4%
Colorado
Con 45.8%
NDP 30.5%
Lib 19.6%
Grn 3.6%
Oth 0.5%
Idaho
Con 63.0%
NDP 19.0%
Lib 12.2%
Grn 5.1%
Oth 0.7%
Montana
Con 54.6%
NDP 24.6%
Lib 15.8%
Grn 4.4%
Oth 0.6%
Nevada
Con 45.5%
NDP 31.2%
Lib 20.0%
Grn 2.9%
Oth 0.4%
Utah
Con 71.5%
NDP 14.5%
Lib 9.3%
Grn 4.0%
Oth 0.6%
Wyoming
Con 67.4%
NDP 16.3%
Lib 10.5%
Grn 5.1%
Oth 0.7%
Again the NDP are the clear opposition here, and again, come 2015...
Newfoundland & Labrador
Maine
Lib 37.9%
NDP 32.6%
Con 28.0%
Grn 1.1%
Oth 0.3%
New Hampshire
Lib 35.8%
Con 32.5%
NDP 30.8%
Grn 0.7%
Oth 0.2%
Vermont
Lib 42.3%
NDP 36.4%
Con 20.0%
Grn 0.9%
Oth 0.3%
The Last Liberal Redoubt of 2011.
Saskatchewan
Iowa
Con 53.9%
NDP 34.7%
Lib 9.1%
Grn 2.2%
Oth 0.2%
Minnesota
Con 52.5%
NDP 35.2%
Lib 9.3%
NDP 2.9%
Grn 2.9%
Oth 0.2%
Nebraska
Con 66.7%
NDP 24.2%
Lib 6.4%
Grn 2.5%
Oth 0.2%
North Dakota
Con 65.1%
NDP 24.7%
Lib 6.5%
Grn 3.4%
Oth 0.3%
South Dakota
Con 64.9%
NDP 25.6%
Lib 6.7%
Grn 2.6%
Oth 0.2%
The same pattern seen previously here of a distinction between IA/NM and the more right-wing ND/SD/NE.
One-state provinces/territories:
New Brunswick
Connecticut
Con 43.8%
NDP 29.8%
Lib 22.6%
Grn 3.2%
Oth 0.6%
Northwest Territories & Nunavut
Hawaii
Con 38.1%
NDP 36.9%
Lib 21.9%
Grn 2.7%
Oth 0.4%
Nova Scotia
Massachusetts
Con 36.7%
NDP 30.3%
Lib 28.9%
Grn 3.9%
Oth 0.1%
Prince Edward Island
Rhode Island
Con 41.2%
Lib 41.0%
NDP 15.4%
Grn 2.4%
Oth 0.1%
Yukon
Alaska
Con 33.8%
Lib 32.9%
Grn 18.9%
NDP 14.4%
(Oth 0%)
The Tories definitely penetrating into non-conventional territory here...
Last edited:
Ontario
Delaware
Con 41.7%
NDP 27.3%
Lib 27.0%
Grn 3.3%
Oth 0.8%
District of Columbia
NDP 43.7%
Lib 43.1%
Con 7.8%
Grn 4.3%
Oth 1.0%
Illinois
Con 42.0%
NDP 26.5%
Lib 26.2%
Grn 4.2%
Oth 1.0%
Indiana
Con 54.7%
NDP 19.8%
Lib 19.6%
Grn 4.2%
Oth 1.1%
Maryland
Con 37.1%
NDP 28.6%
Lib 28.2%
Grn 4.9%
Oth 1.2%
Michigan
Con 46.3%
NDP 25.0%
Lib 24.7%
Grn 3.2%
Oth 0.8%
New Jersey
Con 42.3%
NDP 27.2%
Lib 26.9%
Grn 2.9%
Oth 0.7%
New York
Con 36.8%
NDP 29.6%
Lib 29.3%
Grn 3.5%
Oth 0.8%
Ohio
Con 48.8%
NDP 23.2%
Lib 22.9%
Grn 4.2%
Oth 1.0%
Pennsylvania
Con 48.1%
NDP 24.0%
Lib 23.7%
Grn 3.4%
Oth 0.8%
West Virginia
Con 62.0%
NDP 15.8%
Lib 15.6%
Grn 5.4%
Oth 1.3%
Wisconsin
Con 47.6%
NDP 24.5%
Lib 24.2%
Grn 3.0%
Oth 0.7%
The Tories sweep Ontario due to vote splitting between the Liberals and NDP (which unfortunately due to this methodology is rendered consistent everywhere, rather than realistically the NDP being stronger in some places and the Liberals in the other). And check out the competitive DC!
Last edited:
Quebec
Alabama
NDP 37.7%
BQ 27.8%
Con 19.6%
Lib 12.4%
Grn 1.7%
Oth 0.7%
Arkansas
NDP 35.8%
BQ 27.5%
Con 19.4%
Lib 11.8%
Grn 3.9%
Oth 1.6%
Florida
NDP 46.3%
BQ 21.2%
Lib 15.3%
Con 15.0%
Grn 1.6%
Oth 0.7%
Georgia
NDP 42.8%
BQ 23.5%
Con 16.6%
Lib 14.1%
Grn 2.1%
Oth 0.9%
Kentucky
NDP 36.9%
BQ 27.6%
Con 19.5%
Lib 12.2%
Grn 2.7%
Oth 1.1%
Louisiana
NDP 39.1%
BQ 26.0%
Con 18.4%
Lib 12.9%
Grn 2.5%
Oth 1.0%
Mississippi
NDP 41.9%
BQ 24.7%
Con 17.5%
Lib 13.8%
Grn 1.4%
Oth 0.6%
Missouri
NDP 41.6%
BQ 23.6%
Con 16.6%
Lib 13.7%
Grn 3.1%
Oth 1.3%
North Carolina
NDP 45.1%
BQ 21.9%
Con 15.5%
Lib 14.9%
Grn 1.9%
Oth 0.8%
South Carolina
NDP 41.9%
BQ 24.2%
Con 17.1%
Lib 13.8%
Grn 2.0%
Oth 0.9%
Tennessee
NDP 38.0%
BQ 27.0%
Con 19.1%
Lib 12.5%
Grn 2.4%
Oth 1.0%
Virginia
NDP 46.8%
BQ 20.2%
Lib 15.5%
Con 14.3%
Grn 2.3%
Oth 0.9%
Orange Crush as the NDP sweeps the South. The Bloc's best state is Alabama, but they still barely come within ten points of the NDP either there or Arkansas (the NDP's worst state).
Now to map it...
Makemakean
Mr Makemean
- Pronouns
- Logical, unlike those in German
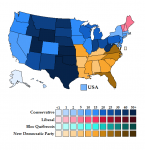
And here's the map.
Aside from New England, it rather looks like one of those 1920s 'Democratic South vs Republican Everywhere Else' maps...
View attachment 2523
My thought actually went to the 1936 election, and how the Liberals' last remaining stronghold in 2011 was the Maritimes in some weird sense parallels New England being the Republicans' last remaining stronghold in that election, something which back then really had nothing to do with policy or ideology, but really everything to do with tribalism and self-identity.
I do of course in particular like how Gary Johnson's New Mexico is one of the areas where "Others" do their best.
Well yes, that's the reason why. One of the Greens' best states being West Virginia also seems appropriate given the industrial devastation there (and indeed in real life West Virginia has a relatively significant green party, but called The Mountain Party because of course it is).I do of course in particular like how Gary Johnson's New Mexico is one of the areas where "Others" do their best.
Makemakean
Mr Makemean
- Pronouns
- Logical, unlike those in German
Well yes, that's the reason why. One of the Greens' best states being West Virginia also seems appropriate given the industrial devastation there (and indeed in real life West Virginia has a relatively significant green party, but called The Mountain Party because of course it is).
That's intriguing information, and, of course, further bad news for the Democrats. Not just do they have to deal with blue collar-workers whose union ties once would have made them sure Democratic voters but who now are angry with the Democratic leadership for their lack of unconditional support for the coal industry, but there are indications that the environmentalists do not think that they are green enough.
Of course, it can be that those Green-voters are only green on some issues, and not so green on others. Just consider the anti-wind farm Greens on municipal level we have here in Sweden...
Well, the Democrats' biggest problem in WV may be that when they do win things, the winner defects to the Republicans a few months later...That's intriguing information, and, of course, further bad news for the Democrats. Not just do they have to deal with blue collar-workers whose union ties once would have made them sure Democratic voters but who now are angry with the Democratic leadership for their lack of unconditional support for the coal industry, but there are indications that the environmentalists do not think that they are green enough.
Of course, it can be that those Green-voters are only green on some issues, and not so green on others. Just consider the anti-wind farm Greens on municipal level we have here in Sweden...
Dan1988
DO! YOU! HEAR THE SONG OF PEACE!
- Location
- North America
- Pronouns
- he/him
Really liking this simulation of the Tory majority in the States, @Thande . As for New Mexico - I could see that as an extension of the Tories' OTL election strategy, where they knew that one key part of winning a majority would be building links with the immigrant communities - at least before it blew up in spectacular fashion in the meantime, particularly during the election campaign with the whole "barbaric cultural practices hotline" debacle (which we all knew what it was really aimed at). Presumably ITTL the Tories also find working with the Hispanic/Latino community a priority (as New Mexico is very heavily Hispanic), and here as with the last couple of elections it shows. That would be my explanation (even in Alberta whatever multiculturalism there is usually trends Tory).
Here's Canada with the 2016 US results.
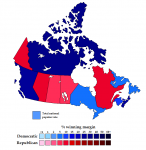
Saskatchewan seems to be a reliable bellwether, it's the main swing province and always votes for the OTL winner.
Doing Canada 2015 in the US is tricky because I now have a procedure based on calculating NDP and Liberals both from the Democrats, but there was a big third party vote in the US 2016 that I could use...hmm.
Right, I think I'll use the third party option for more variation between Liberal and NDP. Another possibility to try in future would be to use Democratic primary votes--I think @Reagent tried something like this before.
Canada 2015 on America-
Alberta
Kansas
Con 58.8%
Lib 20.0%
NDP 15.6%
Grn 3.4%
Oth 2.3%
New Mexico
Con 42.1%
Lib 27.0%
NDP 22.6%
Grn 4.9%
Oth 3.4%
Oklahoma
Con 68.6%
Lib 16.2%
NDP 11.1%
Grn 2.4%
Oth 1.7%
Texas
Con 59.8%
Lib 26.4%
NDP 10.1%
Grn 2.2%
Oth 1.5%
New Mexico stands out due to its OTL big third party vote.
British Columbia
California
Lib 38.3%
Con 29.7%
NDP 23.8%
Grn 7.5%
Oth 0.7%
Oregon
Con 31.4%
NDP 31.2%
Lib 26.6%
Grn 9.9%
Oth 0.9%
Washington
NDP 31.1%
Con 30.0%
Lib 28.3%
Grn 9.8%
Oth 0.9%
Now this is interesting! The OTL BC result was so close that it can be swung by different behaviour in the American 2016 results, different third party strength and the Democrats being stronger in CA. So each state goes to a different party! Did not expect that!
Manitoba
Arizona
Lib 49.1%
Con 38.4%
NDP 9.5%
Grn 2.2%
Oth 0.8%
Colorado
Lib 51.9%
Con 33.8%
NDP 10.8%
Grn 2.5%
Oth 0.9%
Idaho
Con 47.3%
Lib 30.3%
NDP 17.1%
Grn 3.9%
Oth 1.4%
Montana
Con 45.1%
Lib 39.6%
NDP 11.7%
Grn 2.7%
Oth 1.0%
Nevada
Lib 52.6%
Con 36.3%
NDP 8.5%
Grn 2.0%
Oth 0.7%
Utah
Con 31.9%
NDP 31.7%
Lib 26.5%
Grn 7.3%
Oth 2.6%
Wyoming
Con 57.1%
Lib 25.3%
NDP 13.4%
Grn 3.1%
Oth 1.1%
Also rather interesting! Manitoba was close enough that the states do not all go one way, and due to Mr McMuffin the NDP almost pick up Utah! Some of these results do feel plausible, like the Liberals getting a majority of the vote in Nevada and Colorado.
Newfoundland & Labrador
Maine
Lib 65.2%
NDP 19.8%
Con 11.2%
Grn 1.0%
Oth 2.8%
New Hampshire
Lib 65.7%
NDP 18.7%
Con 11.9%
Grn 1.0%
Oth 2.7%
Vermont
Lib 60.8%
NDP 27.8%
Con 5.9%
Grn 1.4%
Oth 4.0%
While these states were close in the US (except Vermont) the Maritimes were overwhelmingly Liberal in Canada. Note the strong NDP performance in Vermont driven by write-ins for Bernie Sanders.
Single-state provinces/territories
New Brunswick
Connecticut
Lib 51.6%
Con 25.4%
NDP 18.4%
Grn 4.7%
Oth 0.1%
Northwest Territories/Nunavut
Hawaii
Lib 47.9%
NDP 29.0%
Con 20.8%
Grn 2.3%
(Oth 0%)
Nova Scotia
Massachusetts
Lib 62.0%
Con 17.9%
NDP 16.3%
Grn 3.4%
Oth 0.4%
Prince Edward Island
Rhode Island
Lib 58.3%
Con 19.3%
NDP 16.0%
Grn 6.0%
Oth 0.3%
Yukon
Alaska
Lib 53.7%
Con 24.3%
NDP 19.4%
Grn 2.6%
(Oth 0%)
See above re. the Liberals and the Maritimes.
Saskatchewan
Iowa
Con 50.4%
Lib 24.6%
NDP 22.8%
Grn 1.9%
Oth 0.4%
Minnesota
Con 43.4%
NDP 27.1%
Lib 26.8%
Grn 2.3%
Oth 0.4%
Nebraska
Con 55.5%
NDP 23.2%
Lib 19.0%
Grn 1.9$
Oth 0.4%
North Dakota
Con 55.1%
NDP 27.9%
Lib 14.3%
Grn 2.3%
Oth 0.4%
South Dakota
Con 58.9%
NDP 20.9%
Lib 18.2%
Grn 1.7%
Oth 0.3%
This different scaling works, I think--it does feel natural that the NDP would be ahead of the Liberals here (well, except in Iowa).
Last edited:
- Location
- Colwyn Bay/Manchester
- Pronouns
- He/him
Where do German Neo-Nazis come in?This different scaling works, I think--it does feel natural that the NPD would be ahead of the Liberals here (well, except in Iowa).
Ontario
Delaware
Lib 46.9%
Con 33.2%
NDP 16.4%
Grn 2.8%
Oth 0.7%
District of Columbia
Lib 78.0%
NDP 15.5%
Con 3.2%
Grn 2.6%
Oth 0.7%
Illinois
Lib 47.0%
Con 29.4%
NDP 19.4%
Grn 3.3%
Oth 0.8%
Indiana
Con 44.4
Lib 32.7%
NDP 18.9%
Grn 3.2%
Oth 0.8%
Maryland
Lib 52.1%
Con 26.4%
NDP 17.7%
Grn 3.0%
Oth 0.8%
Michigan
Lib 41.1%
Con 37.2%
NDP 17.8%
Grn 3.1%
Oth 0.8%
New Jersey
Lib 50.3%
Con 33.8%
NDP 13.1%
Grn 2.2%
Oth 0.6%
New York
Lib 50.3%
Con 29.6%
NDP 14.4%
Grn 2.5%
Oth 0.6%
Ohio
Con 40.9%
Lib 38.2%
NDP 17.2%
Grn 2.9%
Oth 0.7%
Pennsylvania
Lib 43.2%
Con 39.6%
NDP 14.2%
Grn 2.4%
Oth 0.6%
West Virginia
Con 54.1%
Lib 23.1%
NDP 18.8%
Grn 3.2%
Oth 0.8%
Wisconsin
Lib 39.9%
Con 36.6%
NDP 19.4%
Grn 3.3%
Oth 0.8%
A nicely split and nuanced Ontario, with the Liberals winning overall but the Tories holding on to OH, IN and WV, and coming relatively close in (of course) Wisconsin. And a more realistic DC this time.


