• Hi Guest!

    The costs of running this forum are covered by Sea Lion Press. If you'd like to help support the company and the forum, visit patreon.com/sealionpress

Canada-United States Election Conversions

I toyed with the idea of changing my methodology to instead use a multiplicative conversion rather than a purely additive one, but this resulted in the numbers not adding up to 100%, so sod that.

Alberta 1997

Kansas
Reform 59.5%
Liberal 17.4%
PC 9.5%
NDP 6.3%
Other 1.3%

Dole's home st - I mean province - effect is quite visible here.

New Mexico
Reform 48.3%
Liberal 30.5%
PC 6.6%
NDP 5.0%
Other 3.5%

The higher Other numbers for New Mexico are primarily because of it being an unusually strong state for Ralph Nader's Green campaign in '96.

Oklahoma
Reform 54.0%
Liberal 21.8%
PC 11.7%
NDP 5.7%
Other 0.8%

Oklahoma was a surprisingly good state for Perot (and therefore the PCs here) in 96. It may have been the novelty of having third parties to vote for there, but I may be back-projecting if they restrictive laws came later.

Texas
Reform 54.5%
Liberal 25.1%
PC 7.6%
NDP 5.7%
Other 1.0%
 
British Columbia - the Canadian results are quite similar to each other, because so were the original American ones.

California
Reform 43.1%
Liberal 29.4%
NDP 18.2%
PC 5.7%
Other 3.5%

As one might expect, California has the biggest Liberal vote.

Oregon
Reform 43.7%
Liberal 25.5%
NDP 18.5%
PC 7.5%
Other 4.8%

Oregon is (slightly) better for Reform and worse for the Liberals than the other two.

Washington
Reform 42.5%
Liberal 28.2%
NDP 17.9%
PC 7.7%
Other 3.8%

And much the same for WA.
 
Manitoba - this is a bit weird because of how close the NDP and Reform votes were, and added together they almost exactly equal Dole's OTL voteshare, which is odd. Also, the Other vote was actually higher in these states in the US 1996 election than it was in the Canadian 1997 election.

Arizona
Liberal 38.9%
Reform 22.4%
NDP 21.9%
PC 16.7%
Other 0.1%

The Liberals remain on top, but quite a split opposition.

Colorado
Liberal 36.8%
Reform 23.2%
NDP 22.6%
PC 15.3%
Other 2.1%

NDP a bit stronger here.

Idaho
Reform 26.4%
Liberal 26.0%
NDP 25.8%
PC 21.4%
Other 0.4%

What a split! How Canadian! Thus far having different winners for two states within one 'province' has been quite rare, but I think that's going to change.

Montana
Liberal 33.6%
Reform 22.3%
PC 22.3%
NDP 21.8%
Other 0.0%

PCs almost match Reform here (you have to go beyond 3 sf to see a difference)

Nevada
Liberal 36.3%
Reform 21.7%
NDP 21.2%
PC 18.2%
Other 2.6%

Good score for the NDP. One disadvantage of this method is that Reform and the NDP numbers are bound together, so NDP can't come ahead of Reform anywhere rather than there being variation within a "province".

Utah
Reform 27.5%
NDP 26.9%
Liberal 25.7%
PC 18.7%
Other 1.3%

Another dramatic split.

Wyoming
Liberal 29.2%
Reform 25.2%
NDP 24.6%
PC 21.0%
Other 0.0%

Interestingly, Wyoming doesn't join Idaho and Utah in voting Reform.
 
Newfoundland & Labrador.

Maine
Liberal 44.2%
PC 29.0%
NDP 22.5%
Reform 2.6%
Other 1.6%

Maine is the PCs' best state of the three (reflecting Perot's OTL support there)

New Hampshire
Liberal 41.9%
NDP 30.2%
PC 24.5%
Reform 3.4%
Other 0.0%

Note that New Hampshire also slightly breaks maths (the formula splits out -0.2% for Other) but we can probably ignore it in this case. Good score for the NDP.

Vermont
Liberal 46.0%
PC 26.8%
NDP 22.8%
Reform 2.6%
Other 1.8%

This does feel like a realistic result for Vermont if it were Canadian to my mind.
 
I'll do all the one-state provinces at once as they're just the OTL provincial results.

New Brunswick
Connecticut
PC 35.0%
Liberal 32.9%
NDP 18.4%
Reform 13.1%
Other 0.6%

If the US Republicans had split on PC/Reform style lines at this point, I could see them winning Connecticut in the 90s like this.

Northwest Territories
Hawaii
Liberal 43.1%
NDP 20.9%
PC 16.7%
Reform 11.7%
Other 7.6%

Despite the difference in geography, that does feel like the sort of thing one might see in a more small-d democratic Hawaii, especially the big Other vote.

Nova Scotia
Massachusetts
PC 30.8%
NDP 30.4%
Liberal 28.4%
Reform 9.7%
Other 0.8%

This feels a bit more questionable, but remember this is from the 90s, when liberal Yankee republicanism was more of a thing.

Prince Edward Island
Rhode Island
Liberal 44.8%
PC 38.3%
NDP 15.1%
Reform 1.5%
Other 0.3%

Yeah, I could see Rhode Island being the bit of New England to resist the siren song of the PCs.

Yukon
Alaska
NDP 28.9%
Reform 25.3%
Liberal 22.0%
PC 13.9%
Other 9.9%

Again that 'Other' feels authentic. Another NDP win.
 
Ontario

The big one.

Delaware
Liberal 49.1%
PC 20.4%
Reform 18.6%
NDP 10.4%
Other 1.6%

A closely split right, but the Liberals nearly get a majority anyway.

District of Columbia
Liberal 82.5%
PC 11.8%
Reform 1.2%
NDP 0.6%
Other 3.5%

At least DC manages to avoid destroying maths this time.

Illinois
Liberal 51.6%
Reform 18.7%
PC 17.9%
NDP 10.5%
Other 0.8%

Again the Liberals would win even without the closely split right.

Indiana
Liberal 38.8%
Reform 25.4%
PC 20.3%
NDP 14.2%
Other 0.8%

Once again the Liberals win less convincingly with a plurality here.

Maryland
Liberal 51.5%
Reform 19.7%
PC 16.3%
NDP 11.0%
Other 1.0%

Liberal consolidation.

Michigan
Liberal 49.0%
Reform 19.8%
PC 18.6%
NDP 11.1%
Other 1.1%

Not quite a Liberal majority, but close.

New Jersey
Liberal 51.0%
PC 18.4%
Reform 18.1%
NDP 10.1%
Other 1.9%

Similar to the other states above.

New York
Liberal 56.8%
PC 17.8%
Reform 14.8%
NDP 8.2%
Other 1.9%

Aside from DC, this is the Liberals' best state.

Ohio
Liberal 44.7%
Reform 21.4%
PC 20.5%
NDP 12.0%
Other 1.0%

Again a Liberal plurality, albeit not to the same extent as Indiana.

Pennsylvania
Liberal 46.5%
Reform 20.8%
PC 19.4%
NDP 11.6%
Other 1.3%

Still a way off even a united right winning here.

West Virginia
Liberal 48.8%
PC 21.1%
Reform 18.7%
NDP 10.4%
Other 0.5%

Interestingly WV is the PCs' best state (as it was Perot's in this group in OTL).

Wisconsin
Liberal 46.1%
PC 20.2%
Reform 19.8%
NDP 11.1%
Other 2.4%

A united right could beat the Liberals here.
 
Alternatively you could use the Transition Method.
Prithee explain thyself, mathematician.

For Quebec - unlike 1993, Reform did stand, but got a derisory 0.3%, so I've just added that onto the Bloc's vote as I've been using the same column for them.

Alabama
BQ 43.1%
Liberal 33.0%
PC 20.7%
NDP 2.2%
Other 0.9%

Not quite as strong a Southern Bloc victory in Alabama as last time, IIRC.

Arkansas
Liberal 43.6%
BQ 30.4%
PC 22.6%
NDP 1.5%
Other 1.8%

Once again the Clinton/Chrétien home state/province effect kicks in.

Florida
Liberal 37.9%
BQ 35.7%
PC 23.8%
NDP 1.8%
Other 0.8%

Not quite enough snowbirds voting PC to let the Bloc through this time, perhaps.

Georgia
BQ 40.1%
Liberal 35.7%
PC 21.1%
NDP 2.1%
Other 1.0%

Still not quite ready to embrace being part of the New South, it seems.

Kentucky
BQ 38.1%
Liberal 35.7%
PC 23.4%
NDP 2.0%
Other 0.8%

A pretty close result.

Louisiana
Liberal 41.9%
BQ 33.4%
PC 21.6%
NDP 1.7%
Other 1.4%

The Liberals take Louisiana this time. Of course, Clinton won it in 1996 OTL, hence these numbers--I remember those French psephologists convinced Obama was going to get it back in 2008...

Mississippi
BQ 42.2%
Liberal 34.0%
PC 20.6%
NDP 2.2%
Other 1.1%

Not quite the strongest Southern Bloc state this time...

Missouri
Liberal 37.4%
BQ 34.6%
PC 24.8%
NDP 1.8%
Other 1.4%

Once again, doesn't quite fit into the South: the Liberals win this time and a strong result for the PCs.

North Carolina
BQ 41.8%
Liberal 33.9%
PC 21.4%
NDP 2.1%
Other 0.8%

Little sign of any movement away from the Bloc here.

South Carolina
BQ 42.9%
Liberal 33.7%
PC 20.3%
NDP 2.2%
Other 0.9%

SC is the strongest Southern Bloc state this time around--and if it wasn't Mississippi, it does feel 'right' that it would be SC.

Tennessee
BQ 38.8%
Liberal 37.9%
PC 20.3%
NDP 2.2%
Other 0.9%

The Liberals don't quite knock the Bloc off here.

Virginia
BQ 40.2%
Liberal 35.0%
PC 21.3%
NDP 2.1%
Other 1.4%

Virginia remains loyal to the Bloc, for now.


Much more variation between the Southern states than last time--reflecting the muddled OTL results at the time as the Southern realignment towards the Republicans was delayed by Clinton's personal appeal.
 
And finally Saskatchewan. Some more minor maths-breakage here because the Other vote was so low in Saskatchewan. Perot also actually did better in the corresponding states than the PCs did. Indeed, over two-thirds of the OTL vote in Saskatchewan went to either Reform or the NDP, which shows the limitations of this method - unfortunately there can't be areas here where the NDP beat Reform, which would be more realistic, as Reform beat the NDP across Manitoba as a whole. I suppose if you were masochistic enough you could cut up the province on constituency lines and identify chunks with individual states...

Iowa
Reform 35.7%
NDP 30.6%
Liberal 27.6%
PC 5.7%
Other 0.3%

I can imagine Iowa having close three-way races. I mean it does in presidential primaries OTL...

Minnesota
Reform 33.1%
Liberal 28.4%
NDP 28.4%
PC 8.9%
Other 1.2%

A very neatly split left this time letting Reform through.

Nebraska
Reform 43.2%
NDP 37.0%
Liberal 12.3%
PC 7.7%
Other 0.0%

Yeah, feels appropriately agrarian.

North Dakota
Reform 39.5%
NDP 33.9%
Liberal 17.4%
PC 9.4%
Other 0.0%

The Dakotas are quite similar here...

South Dakota
Reform 39.3%
NDP 33.7%
Liberal 20.3%
PC 6.8%
Other 0.0%

...except the South is a bit better for the Liberals and worse for the PCs.

That's done, now to map it.
 
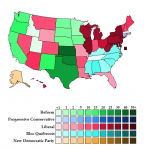
Here's the map for 1996/1997. I like how this neatly mixes the OTL 1997 Canadian trends (Liberals consolidating in Ontario and pushing into Quebec, but challenged by PCs in the Maritimes and Reform in Manitoba) with the OTL 1996 American trends (Clinton's personal vote powerhouse in Arkansas also netting him the neighbouring states of Missouri and Louisiana).

1527767093456.png

As there were more interestingly different results within the "provinces" this time, I might do party-by-party popular vote maps...
 
At least it's nice to see multi-coloured US election maps (that also can be potentially realistic) in something other than red and blue.
 
Prithee explain thyself, mathematician
It's kind of multiplication for parties losing votes and addition for the ones gaining them.
Divide parties into ones increasing voteshare across the whole area and ones decreasing over the same.
Have each decreasing party decrease proportionally in each sub-area.
Put all the votes the differeny losers have lost in each sub-area in one pile.
Reassign each sub-area's pile of changed votes to the parties gaining votes in proportion to the swing to them over the whole area.
 
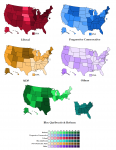
Here are the popular vote maps.

I like how you can almost see imaginary patterns here, like, doesn't the NDP map suggest "the Mormons are a key NDP demographic" to you? The PCs also being strong in Montana/Idaho/Wyoming means one gets the impression that normally conservative states are being won or nearly won by Liberals because of a local party dispute dividing the right in a particularly uselessly even way. The way that the column of agrarian states up the middle is the only part where the Liberals are truly weak is also evocative of the voting patterns seen in the 1940s in the US in OTL.

1527769667052.png
 
Last edited:
Do 1984 for both countries. Should be easy. Just colour all of Canada red, and all of the United States blue.

Seriously, though, I'd suggest you go for 1968 for both countries. With the South as Québéc and vice versa, Social Credit as American Independent and vice versa would be quite interesting to see!
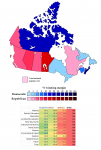
 
Well, US-in-Canada is easy enough to do for @Makemakean 's request, at least. I include the numbers as well so you can see where Wallace did best (obviously close in Quebec, but also, intuitively I feel, well in Alberta).

View attachment 1891
I ran the numbers, but I don't think this one would be as interesting as @Makemakean thought, because Social Credit in 1968 was rather less significant than Wallace, so the US map would be pretty much all blue and red.
 
Back
Top