• Hi Guest!

    The costs of running this forum are covered by Sea Lion Press. If you'd like to help support the company and the forum, visit patreon.com/sealionpress

PM's Election Maps And Stuff Thread

Very nice, I keep meaning to go back and do the rest of the French elections I have data for (which is all of them up to the present day), but it's quite a slog.

I think I ended up using purple for the CNIP, although that does leave you wanting a colour for the DVD - maybe just make the CNIP green? I doubt they'll ever coexist with EELV anyway.
Thanks! And fair enough, I can see why considering you either have to do all the seats twice or slightly cheat like I did. I might go with green just to distinguish the CNIP better, and go with the darker green shades so I can use the lime ones for EELV without worry.
 
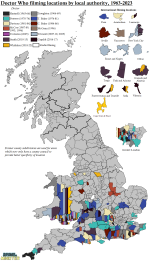
Doctor Who filming locations
"Ah! Good old universal, uncorruptible maps."
1698001847415.png
Predictably, south Wales got a lot more colourful after adding the new series (and I'm fairly certain if I'd included Torchwood, Sarah Jane Adventures and Class it'd be even more so). One thing that I did find interesting is that despite the production teams under Steven Moffat (Smith and Capaldi) and Chris Chibnall (Whittaker) being very different, they actually returned to quite a few foreign filming locations- presumably the Beeb set up local links to make it easier.

And yes, before the Sheffield and Liverpool-based companions Whittaker had, there had been precisely two stories with any location filming north of the Midlands, and there still hasn't been a single one in the North East or Scotland. I would take them off the template if not for the fact that I think leaving it on kinda drives that point home a bit more clearly.
(Though one thing that might be fun to do and would add to the diversity would be to mark on where there have been Doctor Who exhibitions, because there have actually been some of those in the North and Scotland.)
 
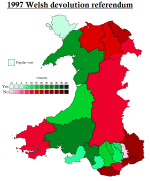
Welsh referendum 1997
So possibly the most famous reform of the Blair government (at least the most famous one anyone thinks positively of) was of course devolution. These had been Labour pledges on-and-off since Wilson's third term, and during the first three years of his rule, four referenda were held on establishing devolved assemblies for London, Scotland, Northern Ireland and Wales. Three of these four were resoundingly accepted (likely because the former two had been unpopularly opposed by the Tories for years, and the latter was a key part of the Good Friday Agreement), but the Welsh referendum was a lot closer.
1699221502103.png
It's strange how much people forget Wales came only 0.6% shy of voting against devolution- a huge turnaround from almost 80% of the country voting against it in 1979, but still very surprising in hindsight considering the country's famous loyalty to Labour and the fact the No campaign was literally chaired by Welsh Tory leader Nick Bourne.

My best guess as to the Yes campaign's near-failure is threefold- one, the Assembly wasn't nearly as well-developed a concept as the Scottish Parliament, NI Assembly or GLA and unlike all three of those it had basically no organised predecessor, so the plan for it was somewhat unclear. Two, at the time it was seen as mostly a nationalist concern, and Welsh nationalism was and is less electorally organised than Scottish or Irish nationalism (just look at Plaid Cymru's comparatively marginal influence). And three, the No movement contained a lot of prominent Labour supporters who opposed devolution; while not as famous as the Scottish anti-devolutionists in Labour, the Welsh ones were a lot more powerful back in the day, and largely opposed it because they saw it as a distraction from the economic issues Wales faced (no less prominent a figure than Neil Kinnock made that claim).

A better explanation from any Welsh users would be appreciated, of course.
 
I wouldn't necessarily say Plaid is less electorally organised, its more that they are much more closely tied to the language divide- especially then.

The 90s result is roughly the heartland Welsh-speaking rural image of Y Fro Gymraeg managing to find common ground with the mining communities most affected by the pit closures who were persuaded/had come to believe they needed a local government to protect them from Westminster (wording may not be the best but still).

The previous referendum had failed because it was seen as being focused on a traditional view of Welsh-speaking Wales and the Eisteddfods that was doing a vital job of preserving centuries of cultural heritage but, frankly, didn't represent the vast majority of the actual population. And then wasn't actually all that powerful a body anyway.
That makes sense, yeah. Thanks for clarifying, it does a very good job of explaining the voting patterns (especially the more urbanised areas of Cardiff, Newport and Torfaen voting No, the first two of which confused me a bit).
 
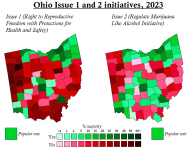
Ohio issue initiatives 2023
Since I woke up today to one of my American friends excitedly telling me Ohio voted to protect abortion access and legalise marijuana last night, I figured I'd map it!
1699461117842.png
I had pretty much expected the county results to be the urban areas around the state's big cities voting Yes resoundingly and everywhere else voting No, so seeing what they actually were was quite a surprise. Issue 1 was close to being that, and probably would've been that if it had been a 50-50 split, but the Yes campaign managed to extend its support across the Cleveland and (to a lesser extent) Columbus and Cincinnati suburbs. Issue 2, on the other hand, did fairly well across the state aside from the northwestern counties, though the cities voted Yes by less towering margins than for Issue 1.

The really surprising part is the margin overall is very similar between the two- around 57% for Yes and 43% for No. Not only is this a really strong result for two pretty firmly liberal-associated policies considering Ohio's recent track to the right, it's also interesting to see how legalising marijuana has a bit more bipartisan support (especially in rural areas) than abortion access. I would guess that's because the latter has been a more consistent Democratic plank, while the former is more linked to changing societal attitudes on cannabis (plus the state Democratic Party endorsed Issue 1 but not Issue 2).
 
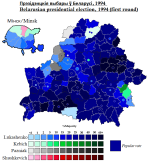
Belarus 1994
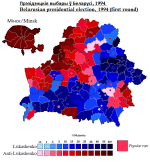
So TIL the Belarusian Wikipedia has the 1994 election results by district, so behold, the only free election they've had there:
1699576572749.png
The second round was won by Lukashenko by over 80% of the vote, so there's basically no point mapping it and the Belarusian Wiki doesn't give the results for it anyway. What's more interesting about the results table, though, is it allows us to see what a vote against Lukashenko would've looked like, since if you add together the votes for the other candidates and 'Against All', they come out with about 52.18% of the vote to 45.76% for Lukashenko.
1699576858072.png
Sadly it's basically impossible this anti-Lukashenko alliance could've been forged, both because of his popularity at the time and because of the fact the anti-Lukashenko candidates were ideologically quite far apart.

For anyone wondering about the details of the non-Lukashenko candidates:
  • Vyacheslav Kebich, the then-Prime Minister, was a Russophilic independent fairly indistinguishable from Lukashenko politically besides possibly being a bit more pro-democracy (and he advanced to the second round against Lukashenko because of course he did).
  • Zianon Pazniak represented the Belarusian Popular Front, and ran on the most anti-Russian platform of any of the candidates. The BPF came out of the anti-Communist movement in Belarus and proposed an alliance of former Eastern Bloc states from the Baltics to Ukraine, which obviously never came to fruition.
  • Stanislav Shushkevich was formerly Chairman of the Supreme Council, getting forced out of office by corruption allegations from Lukashenko in 1993, and later became leader of the anti-Lukashenko Social Democratic Assembly.
  • Alaksandar Dubko of the Agrarians and Vasil Novikaŭ of the Communist Party didn't win any districts, but did take over 10% of the vote between them. Both their parties would split into pro- and anti-Lukashenko wings after he came to power- Novikaŭ became part of the anti-Lukashenko Party of Communists, but I'm not sure which side of the Agrarian split Dubko was on.
Something I find interesting about the voting patterns is there's a strange mix of a rural-urban divide and a geographic divide- the large Polish minority in Grodno Oblast is quite visible too. Surprisingly, use of Russian and Russian ethnicity don't seem to factor into it that much, which surprised me considering how important those are in Ukranian and Baltic politics.
 
Last edited:
London County Council 1889
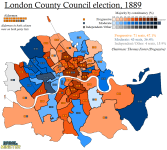
I've been thinking for a while I'd like to do another British electoral map since it's been such a long time, and I finally found something I can do that hasn't been done to death thanks to this yummy, yummy database of all the LCC elections.
1700259960296.png
The London County Council, founded in conjunction with the formation of the County of London, kickstarted 96 years of continuous devolved government in the capital, and is arguably the first proper forerunner to the modern day GLA. The other candidate for that- its predecessor, the Metropolitan Board of Works- was replaced by the LCC because of a series of scandals in its running, its indirectly elected leadership, and the fact its juristiction was unclear given how much of the Metropolis could be claimed by the counties around it, especially Middlesex.

To solve this problem, the incumbent Conservative government (under pressure from the Liberal Unionists, who despite their famous hardline opposition to Home Rule for Ireland were fairly friendly to the desire for local government reforms on the mainland) made one of the provisions of the Local Government Act 1888 the creation of a formal County of London, which included almost the entirety of the old MBW area plus Wandsworth, Battersea and Dulwich from Surrey, and Lewisham and Woolwich from Kent, more or less creating what today is known as 'inner London'.

This area was also coterminous with the parliamentary boroughs used to make the parliamentary constituencies covering the same area, which were drawn as part of the Redistribution of Seats Act 1889 (and, as you can tell, had some hideous detached parts, because 19th century boundaries). Those constituencies were, in turn, chosen as the level at which the members would be elected. Each constituency elected twice as many councillors as it did MPs, so 2 for every regular seat and 4 for the City of London, by FPTP bloc vote. 19 Aldermen were also assigned to serve as members of the council, which was standard practice for the county councils created by the 1888 Act.

It had been hoped that the elections would be nonpartisan, but like the Tory hopes not to have to make a directly elected county council, this was not to be thanks to political pressure. Partisanship was a little different from normal elections, however, both in the sense that it was looser and in the sense that it didn't neatly align with traditional partisanship- that was especially apparent at this election since the parties didn't formally coalesce until after the election. I felt it'd be appropriate to use slightly different colours to normal to represent the competing parties to reflect this (and because it looks more interesting imo).

On the one hand, there was a Liberal-aligned grouping supporting the London Municipal Reform League, which a mixture of Liberals and Fabian-aligned socialists which had fought to introduce local democracy to the city since 1881. They remained united by an interventionist stance in a Lib-Lab esque arrangement, and after the election formed the formalised Progressive Party, which ran the council until 1907 and remained the local banner for the Liberals until 1926.

The opposition basically comprised people who opposed the League, basically recreating the divide of the London School Board (which the LCC would take the powers from in 1904). The anti-League members didn't form a proper political party but did form a collaborative group of sorts with their own whip and their own name- the Moderates (cue a visceral reaction from every Swede on the forum). This name for the right of the LCC would not be as long-lasting as the Progressive moniker, as by 1901 they formally became the local branch of the Tories.

There was also a weird third force in the sense of members elected who the figures in the table I link to don't identify as belonging to either faction, who I've marked down as independents. The plethora of unaligned candidates led to some very weird results, most obviously Hammersmith where an independent Moderate topped the poll in a three-way race separated by 1% of the vote (52 votes between first and third). Some independents were endorsed by their local Tory organisations without being claimed for the Moderates, too.

None of this really affected the bottom line of the election result, though. On a turnout just shy of half the electorate, the Progressive-aligned candidates won a comfortable victory, which was further extended by almost all the aldermen siding with them over (or in a few cases with them as well as) the Moderates. As mentioned, the Progressives would defend this majority in every local election until 1907, helped by the Liberals spending all but three of the next 17 years in opposition.

One interesting titbit is that the LCC in this term saw some landmarks for women's representation; since it wasn't clear whether they were eligible to serve, two women who were part of the Women's Liberal Foundation, Baroness Sandhust and Jane Cobden, ran as candidates under the Progressive banner and were elected (Sandhurst for Brixton, Cobden for Bow and Bromley). Sandhurst's election was successfully appealed by her Moderate opponent and she was forced out in May 1889, but Cobden managed to avoid being drummed out in part because she didn't participate for a year (though she got immediately challenged once she did). The Progressives also appointed Emma Cons as an alderman, the first woman to serve as one in London (and presumably the whole country, though I could be wrong).

I'm tempted to do more of these, but since power only changed hands three times and there were only a handful of really close elections, I don't think I'll do all of them. Fortunately the fairly comprehensive figures I found, and the fact the boundaries were always coterminous with London's Westminster constituencies, will make them quite easy to do if people are interested.
 
Last edited:
There was also a weird third force in the sense of members elected who the figures in the table I link to don't identify as belonging to either faction, who I've marked down as independents. The plethora of unaligned candidates led to some very weird results, most notably in Battersea and Lambeth North where independents top the polls but the major parties somehow actually win the seats. Some independents were endorsed by their local Tory organisations without being claimed for the Moderates on this source too, so that's certainly a thing.

Ah, I think what's happened if they've amalgamated all the candidates under each banner. Or rather they've amalgamated the top vote candidate for all Other party groupings. Which is honestly a bit odd.

So for example in Battersea in 1889 the actual results were:

Burns (Progressive): 3071
Tims (Progressive): 2307
Cameron (Independent Progressive): 2279
Valpy (Independent): 1564
Harrison (Independent): 188
Davies (Independent Progressive): 54

So in publication 3 they've expressed that as 44.4% Progressive, 55.6% Other, but it's probably more accurate to use the figures of 44.4% Progressive, 33% Independent Progressive, 22.6% Independent on the Top Vote.

Although you could also express this as 56.8% Progressive, 43.2% Other if calculating using the All Vote method.
Oh, so the reason they come out that way is basically because the winner only got a plurality and in those seats they rolled all the votes against into one? That makes sense now.

I'll adjust the figures to reflect the voteshares recorded in Volume 1 rather than Volume 3 (or All Vote, since the bloc vote makes this a bit less accurate and more difficult to calculate), thanks for pointing me to that! I think I'll also change the Progressive colour since if I do maps with Labour they could get hard to differentiate as is.

Top Vote may well be better for a block vote system since you can still get situations where the top candidate is from one party but it was the second placed party who actually got more total votes, and of course All Vote is sort of treating it like there's twice as many votes as there actually are since each person has two votes but might only actually use 1.
 
Top Vote may well be better for a block vote system since you can still get situations where the top candidate is from one party but it was the second placed party who actually got more total votes, and of course All Vote is sort of treating it like there's twice as many votes as there actually are since each person has two votes but might only actually use 1.
Top Vote is best IMO, the only time it starts to break down is if you have multiple independents that aren't associated with each other (especially when there are more independents than there are seats on offer!)
 
Top Vote is best IMO, the only time it starts to break down is if you have multiple independents that aren't associated with each other (especially when there are more independents than there are seats on offer!)
Yeah, I'm thinking I'll go with Top Vote because of that. Plus it's the measurement the volumes count for me and demonstrates the highest watermarks of the party and candidate votes, which will make it easier to map than figuring out what percent ahead of each other the various candidates were.
 
Proportional versions of that sort of system tend to use All Vote, but I think they generally also effectively have a "leftover votes go to the party but not any specific candidate" option, whereas in non-proportional ones you have to either vote for candidates not from that party or lose them entirely.
 
LCC 1892 and 1895
Here’s two more LCC elections, which I did together partly because they’re quite easy and because they were both held the same year as two general elections (this would happen three more times in the LCC’s lifespan and twice with the GLC, but hasn’t ever happened with the GLA as of this writing). Every time a London-wide election has been held the same year as a general election, it’s pre-empted the trend of the election in question to at least some extent, as we’ll see.

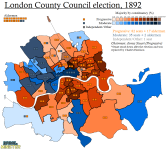
The 1892 election was held at the tail end of Lord Salisbury’s first term, and since the previous term it was clear their hopes for a nonpartisan council had been dashed; almost all the councillors elected had either joined the Progressives or the Moderates; and the Tories’ support for the Moderates was somewhat lukewarm, mostly just focused on attacking the Progressives rather than pushing an alternative programme.

If anything, the main weapon the government had against the Progressives was the ability to deny the council governing powers, with the Progressives demanding the right to command policy over the Metropolitan Police, the water supply and the tramways. The Moderate campaign was largely just predicated on calling the Progressives corrupt for being a political party and supporting Irish home rule. (The party system reminds me a bit of New Zealand around this time- one side proudly aligning with liberalism with the implicit popular support of the public, the other claiming not to align with conservatism while clearly being an opposition party.)

With the momentum at the Liberals’ back, and the hope that a Liberal victory would see the council’s powers extended, the Progressives expanded their majority significantly. All but one of the independent candidates elected in 1889 were also defeated, and there wouldn't be more than one councillor not belonging to the two main parties elected again until 1907.

1700860196954.png

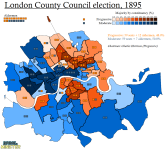
Fast forward to 1895, and the Liberals had significantly declined on the national scene. They had only been able to retake government thanks to a deal with the Irish National Federation to support them, and the push for Irish Home Rule had once again led Gladstone’s government to collapse; he resigned in 1894 and his successor Lord Rosebery, a ‘Liberal Imperialist’ (i.e. right-wing Liberal), denounced the radical elements of the party’s policy agenda, particularly the Newcastle Programme (a set of radical reforms that Gladstone had outlined and advocated at the 1891 National Liberal Federation, a sort of proto-party conference).

The increasingly obvious disunity in the Liberals likely hurt the Progressives, but on top of this Council Chairman Charles Harrison was agitating for unification of the Metropolitan Boroughs and the City of London and for the LCC to take over their powers, a stance which came off as a power grab. Meanwhile, the Moderates were now led by Charles Ritchie, who had supported the creation of the LCC and opposed tariffs, making him a small-m Moderate, if you will.

The election was hard-fought on partisan lines and clearly competitive, as indicated by the fact both parties contested every seat for the first time. The result was also much messier than the last two elections- the parties tied for seats, the Moderates won the popular vote by 2 percentage points, and the aldermen broke strongly for the Progressives. Harrison was narrowly returned as Chairman of the council thanks to the aldermen’s votes, but it was clearly a bad sign for the Liberals, and when the national election was held later that year they would receive a drubbing, holding onto just eight parliamentary seats in London.

1700860211863.png
 
Last edited:
Very much enjoying these - I do, as it happens, have a set of maps of the Parliamentary elections held on the 1885 boundaries either well underway or actually finished, so keep an eye out for those when I get around to posting them.
 
Very much enjoying these - I do, as it happens, have a set of maps of the Parliamentary elections held on the 1885 boundaries either well underway or actually finished, so keep an eye out for those when I get around to posting them.
Thank you! And nice, I remember the 1885 and 1886 ones but I definitely look forward to seeing the rest considering how overlooked this period of British politics is map-wise.
 
LCC 1898
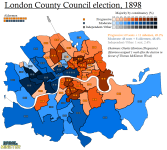
1701184299500.png
The 1898 election saw the LCC swing back to the Progressives despite the Moderates coming extremely close to winning control of it three years prior. This was partly due to the opposition vote returning to the Progressives now the Tories were back in government, but was likely also affected by the Moderates now being led by the Earl of Onslow.

Onslow was a much more controversial figure than Charles Ritchie had been, having served as Governor of New Zealand and agitated for a more conservative administration there, and was at this time double-jobbing as Under-Secretary of State for India; as a campaigner, he tried to radicalise the Moderates (I’m sorry, I couldn’t resist) by making them fight on party lines and calling the Progressives socialist for their interventionist policies.

This was probably not the best strategy considering the Progressives had been trying to push for slum clearance programmes and municipalising gas and water, and were able to claim that the Moderates had been obstructing this agenda. Consequently, the Moderate gains of 1895 were reversed somewhat.

However, this was very much a local victory considering on the national level the Liberals were in a bit of a shambles. The then-Leader of the Opposition William Harcourt was a sort of go-between of the right of the party represented by Rosebery and the left of the party represented by figures like Campbell-Bannerman, and wasn’t a very successful figure on the national stage; once Campbell-Bannerman did get in, the Liberals got a second consecutive drubbing in the ‘khaki election’ of 1900.

Oh, and I just found out something incredible: Marylebone East has been repeatedly electing a Moderate called Lord Farquhar, and County Hall, where the LCC and GLC met, is now home to the Shrek’s Adventure tourist attraction. I genuinely couldn’t make this up.
 
Something I find interesting about the voting patterns is there's a strange mix of a rural-urban divide and a geographic divide- the large Polish minority in Grodno Oblast is quite visible too. Surprisingly, use of Russian and Russian ethnicity don't seem to factor into it that much, which surprised me considering how important those are in Ukranian and Baltic politics.
From what I've read, at that point there was a decent constituency of people who, even if they spoke Belarusian day-to-day, were afraid that state promotion of Belarusian culture would end up being petty and illiberal, a view the Belarusian media (still mostly state-owned by that point) were happy to encourage, and Pazniak didn't always do himself any favours either.

Another view the Belarusian media promoted quite heavily was that nationalism was driving the Baltic states to economic ruin - looks like the Not Lukashenko vote was strongest along the Baltic border, and I suppose people there would have had a few reasons to be more sceptical of that.
 
Back
Top