• Hi Guest!

    The costs of running this forum are covered by Sea Lion Press. If you'd like to help support the company and the forum, visit patreon.com/sealionpress

PM's Election Maps And Stuff Thread

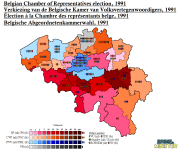
I don't know much about Belgium specifically (paging @Nanwe), but when that happens I usually find it's due to list combinations.

I think in this case it's related to how seats that were not allocated at the constituency level were allocated at a provincial level based on the largest remainders but later distributed to the constituencies. But I have not read the legislation so I'm not sure.

Ah, that would make sense. Speaking of list combinations, I should mention I combined the lists of the Dutch and French-speaking parties in Brussels to get the vote and seat tallies. I'm not sure you're supposed to do that, but it gives you a better idea of how popular the cross-community parties (the Christian democrats, socialists, liberals and greens) are overall, and to my understanding the parties sit together anyway, so I went with it.

A priori, if they ran separately, they ran as separate parties (unless indicated that it's a joint list) even if they tend to sit side-by-side (but not together, it's different parliamentary groups, except the greens).
 
I think in this case it's related to how seats that were not allocated at the constituency level were allocated at a provincial level based on the largest remainders but later distributed to the constituencies. But I have not read the legislation so I'm not sure.


A priori, if they ran separately, they ran as separate parties (unless indicated that it's a joint list) even if they tend to sit side-by-side (but not together, it's different parliamentary groups, except the greens).
Oh ok, thanks for clarifying. Do you think I should edit it to distinguish the Flemish and Wallonian parties' little mans as separate from each other, at least in Brussels?
 
Oh ok, thanks for clarifying. Do you think I should edit it to distinguish the Flemish and Wallonian parties' little mans as separate from each other, at least in Brussels?

I think so, yeah. Brussels/the Brussels-Halle-Vilvoorde constituency was very much the single most conflictive place (the 2010 government formation crisis was literally caused by it) in the communitarian politics of Belgium, so I think it's for the best.

As for the extra people! While I can't find the precise Code électoral as it applied before 1995 (because Belgium's Official Gazette website sucks hard), going through some secondary literatire, it appears that it was possible to do apparentements across constituencies as a way not to lose votes. The specifics of the system are, however, lost on me.
 
Last edited:
Russia 1996 (presidential)
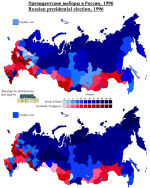
1695410982350.pngI'm not sure if it's accurate to call the 1996 presidential election the most democratic Russia's ever had, but I'd say it is fair to call it the most competitive one it's ever had. For one thing, it was the only time a Russian presidential election went to a second round, and for another, it's the closest any opposition has come to toppling the ruling group in the Kremlin.

Of course, at the start of the year it was expected to see Yeltsin turfed out altogether thanks to the parlous economic state of mid-90s Russia, the two consecutive routs of the Yeltsin-aligned parties in the State Duma elections in 1993 and 1995, the Chechnya/Dagestan crisis, and the emergence of Gennady Zyuganov as a sort of unity candidate between the CPRF and the Russian nationalists who built up enough steam that he was greeted at the 1996 WEF as if he was president-elect.

Seeing this, Yeltsin's allies and the US government spent early 1996 working overtime to pump up Yeltsin's reputation as the democratic capitalist saviour of Russia, which Zyuganov inadvertently played into by getting into bed with the Russian nationalists to try and create a coalition against Yeltsin. By contrast, Yeltsin focused on getting the support of more centrist and internationalist politicians like Alexander Lebed and Grigory Yavlinsky, who both endorsed him and whose votes gave him a comfortable majority over Zyuganov.

The most famous part of this result is how it shows the Russian 'red belt' at its peak, but something that gets easily overlooked is that these areas weren't just enamoured to communism because of the contemporary poverty- they were also drawn to Zyuganov over Yeltsin because he played into Russian and Soviet nostalgia in contrast to the liberalisation of Yeltsin. This is probably why the 'red belt' never became a reliable fixture of Russian politics once Putin succeeded Yeltsin (well, that and Putin's election rigging personal vote); Russian politics wasn't, and perhaps still isn't, so much organised on left-right lines as liberal-nationalist lines, and United Russia coming along and swallowing the nationalist vote while maintaining the anti-communist free market image of Yeltsin basically put the left (and pro-democratic liberals) out of contention.

(By the way, apologies if there are any errors on the basemap- @welections' one was for 2011 and I had to add the federal subjects abolished in the late 2000s back in, so I may have drawn them wrong.)
 
Cambridgeshire 1885-1951
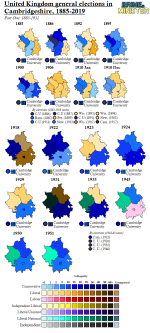
I had a sudden idea for a project I wanted to start, mostly because my parents have been taking an interest in local history- mapping every general election from 1885 onwards in my home county of Cambridgeshire!

Well, I say Cambridgeshire. Something that often gets forgotten is that modern Cambridgeshire is actually made of four counties stapled together; Cambridgeshire proper to the south, the Isle of Ely (named for the cathedral city which, prior to the Fens being drained, was indeed on an island) to the north east, Huntingdonshire to the north west and the Soke of Peterborough (‘soke’ being a sort of in-between of a county and a hundred) north of both of them. Since the four were eventually amalgamated into modern-day Cambridgeshire and all but Peterborough have formed a contiguous group since 1885 (though the next boundary review will ruin that, unfortunately!), it makes sense to cover them all together.

This first box covers the first half of the 36 elections held in the period, so up to 1951. Starting off in 1885, the area had seven territorial constituencies, actually the exact same number as it does today. Of these, Cambridge, Huntingdon and Peterborough are fairly self-explanatory (though the latter just comprised the city rather than the whole Soke), named for their respective county towns, but the rural constituencies were named for small towns rather than geographical areas, as tended to be the case in this period. Huntingdonshire had one, Ramsey, covering the northeastern part of the county, while Cambridgeshire and the Isle of Ely shared three. Wisbech covered most of the Isle of Ely aside from the eponymous city, which was in Newmarket (oddly named after that town rather than Ely despite almost all of Newmarket being in Suffolk), with Chesterton covering the western stretch of both counties.

During this period Cambridgeshire was a prominent swing region, with many of the larger towns (particularly Cambridge, Ely and Wisbech) favouring the Tories while the Liberals enjoyed more rural support. This was largely because of a nonconformist tradition in the rural areas compared to the Anglicanism of the towns (Ely being the obvious example of that), and the fact that the rural areas could easily outvote the towns at this point in time. Perhaps because of this form of liberalism being dominant here, Cambridgeshire wasn’t particularly affected by the Liberal-Liberal Unionist split in 1886; the only seat the latter party ever won here was Peterborough, whose MP was originally an independent Liberal, and the other seats were always just Liberal-Tory races.

Even so, the split did hurt the Liberals here just like anywhere else in the country, and allowed the Tories and Liberal Unionists to make either a clean sweep or near-clean sweep of the county in each of the elections where they won an overall majority. However, the Liberals won as many or more seats than them in every election where they successfully formed a government except January 1910.

One thing that bears noting, of course, is the Cambridge University constituency. Established in 1603 and providing a second vote to graduates of the eponymous university, it not only returned 2 Tory MPs for the entire period, but was only contested twice in the period, in 1906 and in a 1911 by-election. Both times, the only competition was self-described ‘Free Traders’, who stood opposed to Joseph Chamberlain’s protectionist policies.

By 1918, population growth in the area hadn’t kept up with other parts of the UK, and so it was entitled to significantly fewer seats. Peterborough was expanded to contain not only the rural part of the Soke, but also the chunk of eastern Northamptonshire it had long been attached to (so I lopped it out of the inset for now), Cambridge was extended to contain the whole Municipal Borough, and it fell from containing five rural constituencies to three. The three new constituencies- Huntingdonshire, Isle of Ely and Cambridgeshire- were coterminous with their administrative counties (aside from Cambridge being its own seat, obviously), and would remain in existence with only fairly small boundary changes for the next 65 years.

The postwar years were a real transitionary period for Cambridgeshire politics, as Labour began consistently competing in the seats largely to the detriment of the Liberals and the benefit of the Tories. However, the Liberals did retain a solid ground game in the region, shown in their two surges in 1923 and 1929 when they captured Huntingdonshire and the Isle of Ely, while Labour consistently did surprisingly well in the Cambridgeshire constituency due to local rural unionism. Oh, and one notable bit of wackiness is how the 1922 Cambridge by-election was the first of Hugh Dalton’s many unsuccessful attempts to enter the Commons.

Other notable figures (who actually got elected) in the interwar years were J.R.M. Butler in Cambridge University, an Independent Liberal who recruited codebreakers to work at Bletchley Park; Henry Mond, son of Sir Alfred, who won the Isle of Ely for the Liberals in 1923 a few years prior to defecting to the Tories; Hugh Lucas-Tooth, a spectacularly-named Tory who beat Mond in Isle of Ely at only 21 and became Baby of the House; and James de Rothschild, an even more spectacularly named Liberal who beat Lucas-Tooth in 1929 and sat for Isle of Ely until he lost it at the 1945 election. (You might be shocked to find out from his name that he was part of the Rothschild family. Considering he and Mond were both Jewish, the nonconformist vote was likely still a thing helping the Liberals at this point.)

The 1931 election saw Huntingdonshire MP Sidney Peters jump ship to the Liberals while de Rothschild held his seat easily against a challenge from an ‘Independent Farmers’ nominee (backed by Lord Beaverbrook) and a Labour paper candidate, with all the MPs being returned in 1935 with reduced majorities. 1945, by contrast, saw none of the MPs return to Parliament- Peters retired in Huntingdonshire and all three others were defeated, with the Tories taking Isle of Ely (and Labour coming second!) and Labour gaining both the Cambridge and Cambridgeshire constituencies in shock victories.

1945 was also the last time the Cambridge University seat was contested, with Editor of the Spectator Wilson Harris beating out J.B. Priestley (of An Inspector Calls fame) on transfers (the University seats used STV from 1918 to 1945) and serving as one of the UK’s last independent MPs until the election of Martin Bell in 1997. The Representation of the People Act 1949 abolished plural voting in parliamentary elections, and a provision of this was dissolving the university seats. Other than that, the only change for 1950 was expanding the Cambridge constituency to be coterminous with the by now expanded Borough of Cambridge.

Despite losing Cambridge and Cambridgeshire to the Tories in 1950, Labour actually didn’t lose them by particularly towering margins, and their vote in those seats and the Isle of Ely stayed fairly consistent while they actually did slightly better in Huntingdonshire in each election up to 1951. This obviously didn’t translate into seats, though- if anything it just shows what a wasted vote problem Labour had in those two elections. Furthermore, the party would never be able to build on this success in rural Cambridgeshire, and as of this writing has never won any of the seats outside of the county’s cities again.

But anyway, onwards and upwards- I’m halfway through the elections in the county now, and will hopefully finish them off in the next few days!
1695676443713.png
 
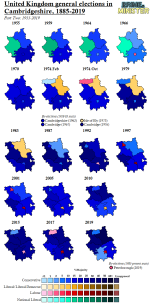
Cambridgeshire 1955-2019
Culturally, the 1950s and early 60s were of course a very interesting time in Cambridgeshire, with the revelation of the spy ring and the start of the rise of Footlights and its huge impact on British comedy. Sadly that didn’t really translate to the area’s politics, which were pretty dull for much of the early part of the period and look that way for almost all of it on the map; the boundaries of the four constituencies remained untouched in the 1955 boundary review and other than a slight but steady swing to the Tories, they didn’t prove that interesting.

The first interesting occurrence was the 1962 Cambridgeshire by-election, where Francis Pym was first elected. Pym was a Cabinet minister under Heath and Thatcher, and under the latter became prominent as a major ‘wet’ critical of Thatcher and Foreign Secretary during the Falklands War. Probably his most famous moment was saying during the 1983 election campaign that ‘Landslides, on the whole, don’t produce successful governments’, for which Thatcher sent him to the backbenches.

As with most places, 1966 saw a big swing to Labour, enough for them to almost take the Isle of Ely and, more noticeably, to successfully take Cambridge. Perhaps not surprisingly given the city’s emerging countercultural left, the Labour MP elected there, Robert Davies, was a CND supporter and vocal critic of Harold Wilson’s policy on Vietnam. However, he died only 15 months after being elected and given Labour’s odds of holding safe seats in the 1966-70 term was touch-and-go, it should be no surprise to find out the Tories easily recaptured it.

After an even duller election in 1970 where not only did the Tories win every seat easily but with the National Liberals being wound up the map turns all blue, 1973 saw a by-election in the Isle of Ely held at the peak of the early 70s Liberal revival. Thanks to this and the unpopularity of the Heath government, the Liberals retook the seat for the first time in 38 years with celebrity candidate Clement Freud, at the time known as Sigmund’s grandson and a prominent broadcaster and later for being Richard Curtis’s father-in-law, but now of course known for the other, far more horrifying thing he has in common with Cyril Smith besides being a long-serving Liberal elected at a 70s by-election.

Moving swiftly on… something notable about the 1974 boundary changes is the absurd situation that explains them. See, as far back as 1947 the Local Government Commission had observed that the four counties comprising Cambridgeshire were too small to continue existing separately while providing local services, particularly because both Cambridge and Peterborough wanted to become county boroughs. When it was suggested they should all be amalgamated into one county, this was heavily opposed, and so when they pointed this out again in 1960 and got slapped down again, two new counties of ‘Huntingdonshire and Peterborough’ and ‘Cambridgeshire and Isle of Ely’ were created. These counties, two of the only ones reformed before 1972, were so stupidly unwieldy they led everyone to give up and agree to a single county of Cambridgeshire at last.

As this implies, 1974 saw Peterborough reintegrated into the county (incorporating Thorney from the Isle of Ely), as well as Cambridge being expanded to comprise the redrawn boundaries of the city; the boundaries were actually still coterminous with their respective counties and boroughs’ boundaries. Peterborough’s extreme political volatility in this period really stands out- in 1966 it had been decided by 3 votes, and in February 1974 it was decided by only 22. It was then one of the seats Labour gained in October to get to a threadbare parliamentary majority.

There were a handful of colourful candidacies in the mid-1970s worth mentioning: in both 1974 elections the Liberals ran the founder of Pizza Express as their candidate in Peterborough, and in the 1976 Cambridge by-election the main event of note was the candidacy of Philip Sargent, who used the label ‘Science Fiction Looney’, inspiring the naming of the Official Monster Raving Looney Party founded six years later. (I actually find the ‘science fiction’ part of the label more interesting though, since it predates both the rise of Douglas Adams and most of Cambridgeshire’s tech industry boom.) He used the candidacy as an opportunity to put out literature attacking the National Front candidate (who got fewer than double the votes he did) and, despite intending to set a Guinness world record for fewest votes, ended up getting loads of votes from students. 1979 saw two more notable Tories get elected. Huntingdonshire, of course, voted in John Major, the most powerful boring man who ever lived, while the Tory who retook Peterborough was Brian Mawhinney, later Major’s party chairman.

By 1983, the boundaries were completely overhauled, with all the existing rural constituencies being abolished. Huntingdonshire was renamed Huntingdon since it was no longer contiguous with the county and took in a big chunk of Peterborough, Isle of Ely had Ely removed from it and was renamed North East Cambridgeshire, and historic Cambridgeshire and Ely were used to create South East Cambridgeshire and South West Cambridgeshire, with South West also taking two wards from Cambridge.

Predictably, every seat except North East went strongly for the Tories, with North East flipping to them in 1987 and Cambridge staying blue despite the SDP literally running Shirley Williams there in her last run for Parliament. While you probably wouldn’t have guessed at the time, this would actually be the last time the Tories won every seat in Cambridgeshire, as in 1992 Labour’s candidate Anne Campbell narrowly gained Cambridge. (Funnily enough, apparently she was one of my dad’s maths teachers and badly underestimated his predicted grades!) Also of note is that for some reason, Huntingdon loved Major- in all three elections in this period he took over 60% of the vote and in 1992 he set a record for the largest numerical majority of any British MP, 36,230 votes, that would stand for the next 25 years.

Further population growth in the area, aided by the rise of the ‘Silicon Fen’ tech industry centred around Cambridge, meant Cambridge gained another seat in 1997, and the seats were redrawn significantly once again. A new North West Cambridgeshire seat was drawn up from northern Huntingdonshire and western Peterborough, South East Cambs shifted northeast to make North East Cambs smaller, and South West Cambs was renamed South Cambridgeshire despite covering the south western part of the county (I’ve never understood that change, honestly).

Even in an area as Tory as this, the Labour landslide of 1997 can sort of be seen- even in the safe seats the margins got massively slashed, especially in North East Cambs where Labour had taken control of Fenland District Council two years prior, and they gained Peterborough resoundingly as well as massively bolstering their margin in Cambridge. (North West Cambs gave Mawhinney somewhere to flee to, though.) Amusingly, the Major effect is still very visible even there- look at how the margin drops after he retires in 2001!

1997 saw two notable MPs elected to Cambridgeshire for the first time- Andrew Lansley in South Cambs, a former Conservative Central Office researcher who later became a very, very hated Health Secretary under Cameron, and Helen Brinton (later Clark) in Peterborough, who started out as a Blairite but her personal popularity declined fairly quickly; she then rebelled against the party line on Iraq and quit the Labour Party after she lost her seat in 2005. Speaking of 2005, that election also saw the Lib Dems gain Cambridge off Labour thanks to Campbell’s failure to oppose tuition fees.

The constituencies were kept the same with some minor boundary changes in 2010, so by now are quite significantly over quota and from what I gather are being substantially redrawn for the next election. A sort of north-south divide can be seen in the 2010 results as the Lib Dems improved their results in the two rural southern seats and held Cambridge easily, while the Tories resoundingly held the northern seats. Speaking of the northern seats, current Cabinet minister Steve Barclay was elected in North East for the first time at this election.

Funnily enough, I actually got to meet a bunch of the candidates in 2015 through them coming to my sixth form. I can’t say I have anything nice to say about Lucy Frazer (South East Cambs), who carpetbagged up here after failing to get selected in Harrow and frankly always come across as a suck-up backbencher. On the other hand, I vividly remember Heidi Allen (South Cambs until 2019) giving a talk to my class and remarking that she ‘couldn’t wait to rebel’- considering she jumped ship to Change UK, The Independents and the Lib Dems in her last year in the Commons, she was more truthful about that than I assumed at the time.

Of course, the actually interesting fight was in Cambridge itself, the only really competitive constituency in the area. The Lib Dem incumbent, Julian Huppert, was actually quite personally popular despite everything, while I remember a lot of people didn’t think much of Daniel Zeichner by comparison, but trying to get elected as a Lib Dem in 2015 was just too much of a millstone, and Zeichner proved likeable enough in Parliament that the Lib Dems haven’t been able to threaten him since.

2017 saw Labour retake Peterborough, and they held it against the briefly ascendant Brexit Party in the 2019 by-election before losing it that December. The really interesting thing in 2019, though, was South Cambs- the council went strongly for the Lib Dems in the local election that year and it swung heavily against the grain due to being similarly strongly pro-Remain to Cambridge itself. Its swing away from the Tories has continued to the point that when the mayoral elections came in 2021, it helped Labour win the mayoralty off of Tory incumbent James Palmer (or ‘that idiot in Soham’ as one of my dad’s friends nicknamed him).

While I don’t want to count my chickens, I feel like the politics of Cambridgeshire is heading in an interesting trajectory. As mentioned, South Cambs is a very attractive future battleground for the opposition, I’ll be interested to see if Cambridge swings away from Labour as and when they get back into government, and Peterborough seems to be stabilising as a core bellwether again (I forget which forum, but someone suggested it’s developing a similar demography to Bedford- a lot of young, working-class and non-white voters in the area than there used to be- and this is making it friendlier ground for Labour than it’s historically been).

I feel like this might not have been that interesting in the grand scheme of things, but hey, I had fun with it! (By the way, thanks again for the map Alex- I found it particularly interesting to see the city core of Peterborough in 1974 perfectly aligns with the 1997-2010 constituency.)
1695937688688.png
 
Last edited:
I feel like this might not have been that interesting in the grand scheme of things, but hey, I had fun with it! (By the way, thanks again for the map Alex- I found it particularly interesting to see the city core of Peterborough in 1974 perfectly aligns with the 1997-2010 constituency.)

It's probably the case that the ward boundaries were still based on that border because of the sequence of how the boundaries were reviewed.

As a general rule, the electoral ward boundaries would have been reviewed in the late 70s to deal with the imbalances between the interim wards which were usually just inherited from the previous authorities, then the parish boundaries would have been reviewed in, I would expect, the 80s. The 1997 constituencies would have used the council wards as its building block and been sorted out in the early 90s, and then the next review of the electoral ward boundaries was probably around the turn of the millennium.
 
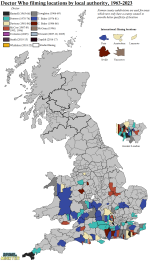
Since the Doctor Who anniversary is next month, I've started working on something fancy, and I feel like sharing the WIP:1696173169321.png
Despite the title, the map so far is every single location used for filming the classic series. The southern focus is quite obvious, to put it mildly.

In case anyone was wondering, the winner of local authority most frequently used was South Bucks, as every single classic Doctor except McGann had at least one story with location footage filmed there. I should also mention multi-Doctor stories are categorised by the incumbent Doctor (so the locations for The Five Doctors are down as Davison for example).

Credit for the basemap goes to Thande as this is a substantially altered version of his old constituency maps (which in turn I believe are based off of David Boothroyd's, though correct me if I'm wrong). I did my best to make the boundaries into those for the local authorities from 1973 to 2009 (and the current ones for Scotland and Wales) for this map- partly because it makes the map more contemporary to the classic series, and partly because they subdivide every county except Rutland and make it easy to see roughly which bit of the county filming was done in.
 
Australia 1980 and 1983
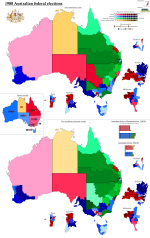
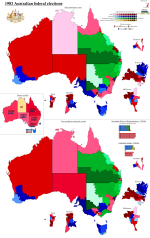
I’ve been sitting on some partially-finished edits of Max’s Australian election maps for 1980 and 1983, and have been waiting for a kick up the backside to post them- surprisingly, that isn’t the referendum they held the other day, but me rediscovering my old soft spot for Kylie Minogue. Fever (2001) is a hell of a drug. 😜

1697478263528.png

Anyway, the 1980 election was basically the first one since 1974 to be properly competitive. Malcolm Fraser’s popularity had declined somewhat due to the economic problems facing Australia thanks in part to his government’s antipathy towards the economic reforms supported by the right, hostility to unions and ambivalence towards free trade, while his embrace of multiculturalism was rightly applauded in some corners (particularly as he is seen as having played a key role in helping end the white minority rule in Zimbabwe and encouraged acceptance of refugees) and more negatively thought of in others.

Ironically, the right of the Coalition wasn’t what Fraser suffered vote splitting from, but the left, as the Democrats continued to gain popularity thanks to their opposition to the Franklin Dam’s construction and the belief that by holding the balance of power, the centrist third party could, as their leader Don Chipp succinctly put it, ‘keep the bastards honest’.

Meanwhile, with Gough Whitlam having finally resigned after the party’s second landslide defeat, Labor sought a new leader. They found it in the form of Bill Hayden, former Treasurer and Minister for Social Security who had introduced Medibank (the precursor to Medicare, which the Fraser government steadily privatised, slashed and then dissolved during its three terms). Despite this and his youth at only 45, Hayden was not seen as a very strong leader, with his moderate economic policies proving uninspiring to the base; he had to be backed up during the 1980 campaign by NSW Premier Neville Wran and (in a premonition of things to come) Bob Hawke to try to strengthen Labor’s image.

Labor did manage to dent the Coalition’s majority, but weren’t able to achieve the huge swing needed to retake government (even though they came less than 2% shy of winning the two-party vote). If anything, the big winners of the 1980 election were probably the Democrats, as they successfully deprived the Coalition of their majority in the Senate, establishing themselves as a significant political force far more strongly than they had in their first election, in contrast to Labor staying put in that chamber despite gaining 5 points in the popular vote.

(Oh, and something to note about Queensland: this election saw the two Coalition parties fight the Senate election separately, hence Labor winning more seats than either of them. I suppose there is more Scandinavian about Joh Bjelke-Petersen than just his name…)

*
1697478354441.png
1983 is probably the more interesting of these two elections for a few reasons- first, it was the first of five Labor election victories, a result which has not been matched by either party since; two, it was such a stark contrast to the British election held a few months later; and three, that year’s election night broadcast had this fancy little intro featuring Gerald Scarfe-esque animated caricatures of Hawke and Fraser. (I’m curious now if Yes Minister had made it to Australia by this time or if it’s just a coincidence?)

Fraser’s government being brought down can mostly be blamed on two major developments: the continually deepening early 1980s recession (predictably enough) and his own Liberal Party’s severe infighting. Having said that, the decision to abolish Medibank (which was later reinstated by the Hawke government under the name Medicare) and so end universal free healthcare access likely didn’t help.

There was considerable conflict over what economic policy should be going forward: within his government were vocal supporters of ‘economic rationalism’, which was basically a buzzword for ‘neoliberal economics’ (though to a degree it was an effort to make the Australian economy more globalised as well). Furthermore, his then-Minister for Industrial Relations Andrew Peacock resigned and forced a leadership challenge. While Fraser won, it showed his support within the party was decidedly less stable than one would hope.

On the Opposition benches, Labor had an interesting situation: its then-leader Bill Hayden had cut Fraser’s majority in 1980, but many Labor supporters doubted he could win, particularly after Labour failed to win a by-election for Flinders in Victoria in December 1982. Furthermore, Hayden was was less personally popular than the Prime Minister and far less so than his main rival for the leadership- former President of the ACTU (Australian Council of Trade Unions) Bob Hawke.

Hawke is a complex figure, to put it mildly- on the one hand, he was originally elected with the support of the left of the ACTU, some of whom were even communists, and he’d come to prominence in 1971 when he requested South Africa sent a non-racially biased rugby team to Australia, and when they refused and anti-apartheid protestors disrupted games, Hawke helped ensure the Springboks were denied entry- they would not return until after apartheid ended. On the other hand, he had a steadfast commitment to negotiation between unions and employers, a premonition of things to come, and acted as an informant for the US government during labour disputes in the 1970s. He became greatly popular with the public for helping avert national strike action, for publicly overcoming his alcoholism, and on a darker light, perhaps for his opposition to Vietnamese boat people coming to the country, something Fraser supported.

Knowing how potentially the fractures between Hayden and Hawke could be even more humiliating to Labor than his own party’s had been to him, Fraser wanted to call an election before the end of 1982, or at least early on in 1983. Ultimately, Parliament was dissolved on the 4th February 1983. However, Fraser wasn’t quite fast enough to stop Hayden resigning (after Flinders, the party room had the leverage to make him) and Hawke taking over unopposed on the 3rd February 1983. Despite Hayden famously claiming ‘a drover’s dog’ could win the election for the ALP, their new leader was decidedly more formidable than a drover’s dog would have been.

Just to twist the knife in even more for the Coalition, the Ash Wednesday bushfires hit the country during the campaign, and Fraser had to put his re-election campaign on hold to tour the areas, enjoying basically no boost from it. Meanwhile, Hawke’s campaign cleverly played on his consensus-building, right down to its slogan- ‘Bringing Australia Together’- starkly contrasting itself with the infamous divisiveness of the Whitlam government.

All this worked a treat for Labor, who won an overall majority for the first time in 11 years, and as mentioned, would begin 13 uninterrupted years in government in Australia, the second-longest since the war and the longest for Labor by a considerable margin.
 
France 1981
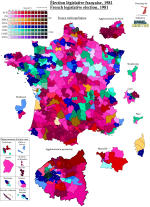
Behold, Mitterand's_coattails.png
1697897917312.png

I sort of found a way to roll both rounds into one map- every race that had a second round has the second round result shown, every race that just had a first round has the first round result shown with the asterisk. The asterisk also denotes the margin in races where two ideologically similar parties (in this case it was just the PS and PCF, except one case where the PS did it for the MRG) came first and second and the second placed one stood aside to let the first placed one run unopposed in the second round.

As for why the parties are formatted the way they are, I'm going by French Wikipedia's distinctions- it distinguishes between DVG, MRG and PS members and between DVD, CNIP and UDF members, but not the little factional parties and members elected under the PS banner or the various smaller parties within the UDF. Plus it saves on having to use too many colours (though I'll admit the CNIP colour could stand out better from the UDF- anyone got any suggestions besides using the two blues? I want to avoid that because redoing all the RPR seats would be a real headache).
 
Very nice, I keep meaning to go back and do the rest of the French elections I have data for (which is all of them up to the present day), but it's quite a slog.

I think I ended up using purple for the CNIP, although that does leave you wanting a colour for the DVD - maybe just make the CNIP green? I doubt they'll ever coexist with EELV anyway.
 
Back
Top