• Hi Guest!

    The costs of running this forum are covered by Sea Lion Press. If you'd like to help support the company and the forum, visit patreon.com/sealionpress

Caprice's Maps and What-Not

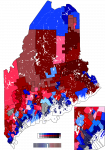
I've been working on some raster maps again; here's Maine's most recent state house election as a look at that style:

2020.png
It's meant for dark mode, so all the text is white. My apologies for that.

I'm worried about the time when I have to do the unreformed districts, because contiguity was not even considered when drawing them.
 
1673722142898.png

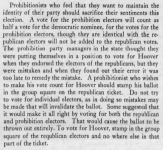
This is interesting -- in 1928, the California Prohibition Party nominated the Republican slate thinking it would work along fusion rules, but it didn't, and there was fear that they might accidentally throw the election to Smith. Ultimately, Hoover won by some 30%, but I can't seem to find any sources online that break down his vote between the two party labels.
 
1679348567621.png

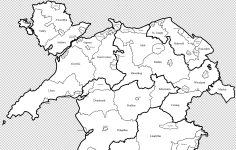
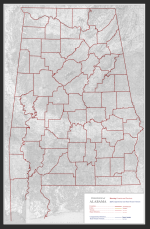
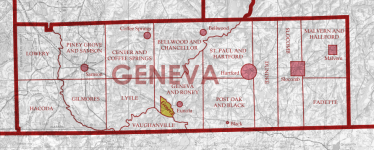
Playing with a map style I started to throw together, mostly based on American census maps. Not sure if I want to color in the urban districts and met. boroughs yet, but right now I'm just getting the borders and labels down.

I think it'll be quite useful for district maps, both administrative and electoral.
 
View attachment 67009

Playing with a map style I started to throw together, mostly based on American census maps. Not sure if I want to color in the urban districts and met. boroughs yet, but right now I'm just getting the borders and labels down.

I think it'll be quite useful for district maps, both administrative and electoral.
Looks nice, paging @OwenM

Incidentally, @Caprice , did you ever find any data for the 2016 presidential primaries broken down by state house or senate district? (So I could do state-level America Divides). I did have a look online after we discussed it but couldn't find anything. Presumably somewhere it exists by precinct and could be totted up but that'd be rather tedious. Probably the most interesting states to do would be places like Illinois and Wisconsin where several 'parties' were in contention.
 
Presumably somewhere it exists by precinct and could be totted up but that'd be rather tedious.

That is generally the problem, yeah; I tried Daily Kos but they only do it for the general elections. Delaware tallies their precincts up by state house district, but they seem to be the only one.
 
My work on a Big Fancy Atlas/Databook of the 1928 presidential election continues, bit by bit. Apparently this involves:

  • the presidential vote by county, of course, but:
    • each elector's separate total if elected separately; these are averaged by ticket to get the Official Vote(tm) for my purposes
    • for states that use the modern system there's a roster of electors; at least one state is proving difficult to find this
  • presidential preference votes by county if available; Massachusetts only has them by CD but I just did the statewide results because they were blowout victories and I'm fairly sure the results were displayed in the most infuriating way possible
  • National Convention delegate votes:
    • if there's no direct preference vote and the delegates are clearly arranged into tickets, do them by county and average them for an official vote
    • if there is a direct preference vote or delegates aren't clearly differentiated by ticket, just do the totals by either state or district depending
I haven't decided on the colors for primary contests, but there'll be a few. The Democrats had an attempt at a three-way contest, but I'm not sure there was a single competitive contest in the Republican primaries. Also, I can't find the DNC vote by state whatsoever, so I don't know how to map it.

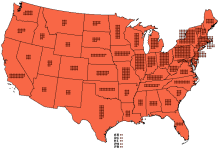
For the big nationwide map, I only want to display results for candidates who had 266 (a majority) or more candidates for elector (so Hoover, Smith, Thomas (Socialist), Foster (Workers'/Communist), and maybe Reynolds (Socialist Labor)), since I don't think any other candidate is overriding this normal metric by winning counties or doing really well in a specific state, but I'm not sure what metric to use for the primary map yet, since the primaries were too scattered to come up with an analogous metric. Maybe winning votes in the national convention or winning counties.
 
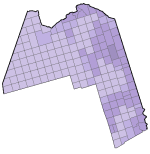
In the style that a couple people here have been doing municipality maps in, Aroostook County, Maine, in 1950:

1686901658203.png

I'm putting together a decade-by-decade map series, and 1950 is a good branching-off point because there's a bunch of detailed maps from that year's census (and it's the last to list all the disparate unincorporated townships separately).
 
Last edited:
Living up to my name, I've decided not to do it county-by-county, but instead I'll try it decade-by-decade - on that note, do @Ares96 and @Alex Richards have a color palette for this? I imagine there's no coherent color scheme due to the various nations people use it for, but I can put one together specifically for US things.
 
Living up to my name, I've decided not to do it county-by-county, but instead I'll try it decade-by-decade - on that note, do @Ares96 and @Alex Richards have a color palette for this? I imagine there's no coherent color scheme due to the various nations people use it for, but I can put one together specifically for US things.

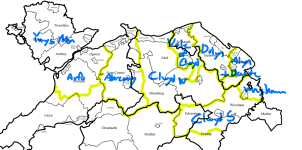
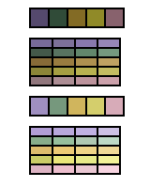
I've got a colour palette, but I don't think it's necessarily possible to try and have some sort of universally applicable system - the US has incorporated and unincorporated townships and that's similar to the non-parochial areas of the pre-1974 system but it's not exactly the same you know?

Parishes schemes.png
 
I've got a colour palette, but I don't think it's necessarily possible to try and have some sort of universally applicable system - the US has incorporated and unincorporated townships and that's similar to the non-parochial areas of the pre-1974 system but it's not exactly the same you know?

View attachment 70110
Excellent, thanks! It's going to be a mess regardless, so I just want to try to have some internal consistency.
 
Back
Top