• Hi Guest!

    The costs of running this forum are covered by Sea Lion Press. If you'd like to help support the company and the forum, visit patreon.com/sealionpress

Max's election maps and assorted others

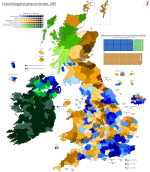
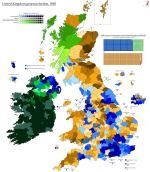
New year, old project! I've decided to go back to the 1885-era UK Parliament maps, redo some of the insets to make them more legible and get the rest of the elections held under these boundaries drawn. First, though, I have a question for you, the reader: there was a pretty loose definition of what a "Conservative" or "Liberal" was at this point, and as such, there are at least two different possible ways to depict the different moving parts within the two broad alliances that made up (mainland) British politics. I've already decided that the Liberal Unionists were distinct enough from the Tories proper to deserve their own colour, but what should I do about the Independent Liberals/Conservatives and the Lib-Lab candidates? I've attached the new 1885 maps in two different versions: one (the original) where all three flavours of Liberal get the same colour, with markers for the Ind Libs and Lib-Labs, and one where the two subgroups each get their own colour. There's pros and cons to both of these, as far as I'm concerned: the asterisks and letter marks clutter the map a bit, which is never nice (especially given the number of discontiguous and two-member seats already cluttering things more than enough), but OTOH, the separate shades might not be different enough to stand out.

val-uk-1885.pngval-uk-1885-colours.png
 
My preference is generally for the "cleaner" look, so I'd vote for the second version.
Think I’m leaning the same way - it’s not like I have a shortage of shades compared to the number of parties.
 
Ooh, very detailed; great work! There's an Ind. Liberal still marked with an asterisk in Cornwall on the bottom map -- thought you should probably know.
 
Ooh, very detailed; great work! There's an Ind. Liberal still marked with an asterisk in Cornwall on the bottom map -- thought you should probably know.
I did notice that immediately after uploading, of course - there’s also two districts of burghs in Scotland that should be yellow.
 
Okay, a slight update. I've hopefully corrected all the Independent Liberals, drawn insets for Belfast and Dublin, and changed the colour scheme to the new blues so that the Liberal Unionists in 1886 contrast better with the IPP.

val-uk-1885.png
val-uk-1886.png
 
Okay, so I've had a map of Sweden's districts done for some time, and the other day I took it upon myself to finish adjusting it to show the parishes that have merged since the Church of Sweden was disestablished. The church tends to follow the rule of subsidiarity as far as this goes, but a lot of parishes (especially rural ones) tended to be so small that, without state support, it was impossible for them to sustain themselves economically. There have essentially been two different ways to deal with this: either several parishes merge into one bigger one, or a number of small parishes (or one large one and several small ones adjacent to it) form a pastorat, a joint administration where they share a parish priest (hence the name) and an elected council, but retain some measure of self governance (I don't understand precisely what the individual parishes inside a pastorat actually do, but apparently something). From 2,523 in 1999, mergers have resulted in the church now having 1,292 territorial parishes as well as five non-territorial ones - the Royal Court Consistory, the German parishes in Stockholm and Gothenburg, the Finnish parish in Stockholm, and the Karlskrona Admiralty parish, which is the last of several military parishes that used to exist around the country - and 30 parishes ministering to members of the church who live abroad. They still vary in population from the dozens to the tens of thousands, but most of the very smallest ones have disappeared from the map.
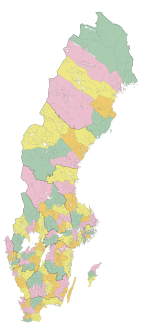
församlingar-2021.png

I also figured out that the Church of Sweden releases annual membership statistics for all the parishes, including percentages of the population. This obviously gave me an idea, and here's the map. We can see some general patterns - membership tends to be higher in rural areas, for one, which is not unexpected. Nor is the fact that, in cities with more than one parish, membership is generally lowest in working-class areas with large immigrant populations. The parish with the lowest membership in the country was Bergsjön, in Gothenburg, with 10.6% of the population enrolled in the church, while the highest membership is found in Älekulla, about 60 km to the southeast, where 85.7% of the population are church members. The other two notable outliers are Bergslagen, which is dominated by large industries and tends to be unchurched as a result, and the Bible Belt in the inland south, where independent churches capture a large chunk of the population.
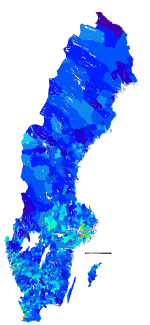
församlingar-2021-procent.png
 
Is it possible (as in does the requisite data exist) to map out support for the various factions/parties in Church elections by parish, or does the Church not keep data that granular?
I’m working on that. Unlike the general elections, Church election data is only reported down to constituency level, so the only results you can get at that granular a level are parish council elections. Which is a shame, because those often don’t exactly resemble the party landscape at the national level most of the time.
 
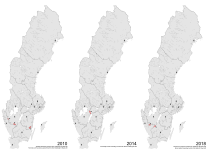
But first, a test for something else - a series showing the territorial evolution of the dioceses. The really interesting changes are the ones that happened before about 1920, but those a) require a lot of fiddling with exact parish boundaries that I'm going to find a nightmare to track down (Swedish Wikipedia is nowhere near as thorough as German Wikipedia for things like this, sadly), and b) would probably not be done justice on a basemap that doesn't include Finland. I have had a madcap idea to add Finland to this basemap, but that's going to take ages to do and I'm not too keen on that right now.

1675191809477.png
 
Back
Top