• Hi Guest!

    The costs of running this forum are covered by Sea Lion Press. If you'd like to help support the company and the forum, visit patreon.com/sealionpress

Cartographicum Thandeum

Crossposted - all the national Australian referendums, as they've just had one.

Oh, go on then. (Click to enlarge)

View attachment 74354

You and @Lord Roem weren't kidding. The Australian electorate never met a proposal they didn't want to say 'no' to. I'm not sure they'd vote the federal government power to push the asteroid-stopping button for 1 minute if it was about to hit them. Mind you, I imagine I'd be less than inclined to vote yes if the government kept asking you the same question every few years till it got the 'right' answer.
 
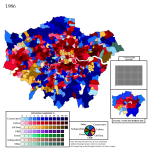
Another preview of some London local elections, this time 1986. I really need to figure out that changed border between Barking & Dagenham and Redbridge, I've just put the affected ward in lime green for now.

1697549616026.png

1986 was most noteworthy for the Liberal-SDP Alliance almost exactly doubling its councillors to 249, with breakthroughs in some places that would go on to be Lib Dem strongholds later (or were already Liberal-supporting areas), while others would go on to fizzle out. You can see the impact of the Bermondsey by-election. The Alliance gained control of Richmond upon Thames (in a landslide), Sutton and Tower Hamlets, the last obviously being the odd one out for long-term support. The Alliance also pushed Kingston upon Thames into No Overall Control. Labour also made significant gains and took control of three boroughs that had previously been NOC - Hammersmith & Fulham, Lambeth and Waltham Forest. However, though Labour won the most votes in Wandsworth, a wrong-winner result left it under Conservative control, where it would stay until 2022 - having been run by the Conservatives for a whopping 44 years.
 
Last edited:
Thanks Alex, much appreciated!

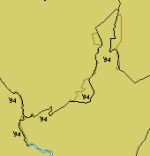
I'm mostly ignoring borough boundary changes out of trepidation it'll never be comprehensive, but I felt this is one I can't miss as it involved the movement of an entire ward from one borough to another.

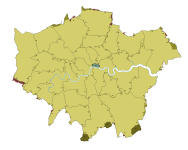
This should be pretty comprehensive.

Slight note: because I tend to work backwards the red areas are those which became part of Greater London in either '94 or '70, and the two darker shades of yellow were moved in in the relevant date- which of course means starting with the modern borders you're either taking them away or adding them in.

London Comprehensive.png
 
This should be pretty comprehensive.

Slight note: because I tend to work backwards the red areas are those which became part of Greater London in either '94 or '70, and the two darker shades of yellow were moved in in the relevant date- which of course means starting with the modern borders you're either taking them away or adding them in.

View attachment 74500
Thanks Alex, that's great!

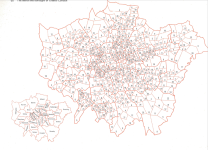
I do wish we could get some good ward maps for the 1964-1978 period (of which there are sometimes more than one map in some boroughs). I've only found them for a few boroughs. I do have a 1971 map but it's quite stylised and the wards are represented with mathematical idealisations which are a bit too vague to use (see below).

1697708042212.png
 
Thanks Alex, that's great!

I do wish we could get some good ward maps for the 1964-1978 period (of which there are sometimes more than one map in some boroughs). I've only found them for a few boroughs. I do have a 1971 map but it's quite stylised and the wards are represented with mathematical idealisations which are a bit too vague to use (see below).

There's ward boundaries on the National Grid 1:1250 series, but annoyingly the London and environs map set on the National Library of Scotland database (which covers everything out of copyright they have and have uploaded) stops partway through Edmonton. And I'm not sure if these aren't earlier than that anyway.
 
I do wish we could get some good ward maps for the 1964-1978 period (of which there are sometimes more than one map in some boroughs). I've only found them for a few boroughs. I do have a 1971 map but it's quite stylised and the wards are represented with mathematical idealisations which are a bit too vague to use (see below).
This is what every single map of French communes looks like.
 
At some point I will need to apply the boundary corrections Alex kindly provided, but in the meantime here's more imperfect maps using the anachronistic modern borough boundaries.

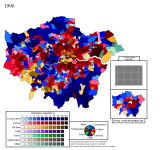
This is 1990, which is a difficult set of elections to classify. It was the last set of elections under Mrs Thatcher as PM, the first with the Liberal Democrats (who performed poorly, reflective of their shaky start elsewhere) and the Green Party came off the back of their 1989 surge by taking 6% of the vote - but no councillors. The Conservatives staged something of a net fightback, gaining 46 councillors (and control of Hillingdon from NOC) while Labour lost 31 (and control of Brent to NOC). Not bad for a party that had been in power for 11 years under an increasingly embattled PM. The Lib Dems lost 22 councillors, about ten percent of their total, but retained control of their three boroughs - Richmond upon Thames, Sutton and Tower Hamlets. Labour did have some successes, though, for example gaining 5 seats and becoming the top party in Havering (which remained NOC but now under Labour leadership), something that seems very unlikely today.

Z-London 1990 test.png
 
Last edited:
I did wonder whether I should look at boundaries before doing this, but then I realised most of the borough boundary changes happened in '94 (I think just before this vote) so might as well, just don't pay close attention to Kingston.

Z-London 1994 test.png

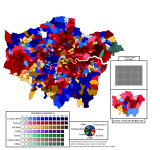
In some ways the 1994 local elections were a nadir for the Conservatives, but this is regionally variable. The major benefactor of the Tory collapse were not Labour but the Lib Dems, which so recently had seemed as though the wheels were coming off their merger. In fact London was the engine of Labour's gains (the last election fought by John Smith, who died a week later). Labour gained 118 councillors in Greater London but a net of only 44 across the entire local elections, so without London they would actually have lost seats. By contrast, the Lib Dems gained 96 councillors in London but a whopping 428 across the country.

The position in London is more complex because demographic and economic change since then means that this generally isn't Labour's high point - not only did the Tories still hold Wandsworth and Croydon here, for example, which are in play today, but still had more strength even in places like Greenwich asnd Lambeth compared to what they do now. The Tories even topped the polls in Brent (which was NOC). Conversely, however, Labour performed better in councils such as Havering and Bexley compared to what we would expect now even in a Labour landslide. The Lib Dems topped the polls in Sutton, Kingston upon Thames, Richmond upon Thames, losing Tower Hamlets to Labour but also coming top for the first and only time in the almost-as-incongruous Harrow. The Tories lost Barnet, Bexley Harrow and Redbridge to NOC, the Lib Dems gained Kingston from NOC, but Labour actually lost Waltham Forest to NOC thanks to Lib Dem gains.
 
Yes. Quite different. Harrow is 45.2% Asian, has less graduates, less higher end jobs than Richmond and less owner occupiers than either of then.
Didn’t realise, I guess either because of the public school or because my knowledge of suburban London’s voting habits only really goes up to the 1970s.
 
I did wonder whether I should look at boundaries before doing this, but then I realised most of the borough boundary changes happened in '94 (I think just before this vote) so might as well, just don't pay close attention to Kingston.

View attachment 74703

In some ways the 1994 local elections were a nadir for the Conservatives, but this is regionally variable. The major benefactor of the Tory collapse were not Labour but the Lib Dems, which so recently had seemed as though the wheels were coming off their merger. In fact London was the engine of Labour's gains (the last election fought by John Smith, who died a week later). Labour gained 118 councillors in Greater London but a net of only 44 across the entire local elections, so without London they would actually have lost seats. By contrast, the Lib Dems gained 96 councillors in London but a whopping 428 across the country.

The position in London is more complex because demographic and economic change since then means that this generally isn't Labour's high point - not only did the Tories still hold Wandsworth and Croydon here, for example, which are in play today, but still had more strength even in places like Greenwich asnd Lambeth compared to what they do now. The Tories even topped the polls in Brent (which was NOC). Conversely, however, Labour performed better in councils such as Havering and Bexley compared to what we would expect now even in a Labour landslide. The Lib Dems topped the polls in Sutton, Kingston upon Thames, Richmond upon Thames, losing Tower Hamlets to Labour but also coming top for the first and only time in the almost-as-incongruous Harrow. The Tories lost Barnet, Bexley Harrow and Redbridge to NOC, the Lib Dems gained Kingston from NOC, but Labour actually lost Waltham Forest to NOC thanks to Lib Dem gains.

Of course, only eight years later in 2002 all but three Lib Dem candidates in Harrow were barred from standing because on the nomination forms they wrote 'Liberal Democrat Focus Team' rather than 'Liberal Democrat'.
 
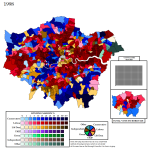
The last of these unfinished scratch maps of London local elections in the 1978-1998 period, where for 20 years (nearly) all councils used the same boundaries. This is 1998.

Z-London 1998 test.png

Labour might now be in government, but the 1998 local elections represented only very limited swingback to the Conservatives across all the councils contested, and in London they were practically status quo ante bellum. Hillingdon and Bexley saw shifts from Labour to the Tories, but rather marginal ones. The Tories gained a net of only 19 councillors across the whole of Greater London, while Labour gained 6 overall and the Lib Dems actually lost 22, reflecting ground lost to the Conservatives in southwest London and to Labour in places like Tower Hamlets. The Lib Dems did, however, top the polls in Islington and drive it into NOC (ironic considering the usual association of 'Islingtonianism' with Blair's government). Overall the pattern remained one of Labour dominance, even with Labour gaining control of Brent, Lambeth and and Harrow. Hackney is a good preview of what would come later in urban centres as the New Labour government as time wore on, with people turning to a ragbag assortment of different options but relatively few willing to consider the Tories.
 
Back
Top