• Hi Guest!

    The costs of running this forum are covered by Sea Lion Press. If you'd like to help support the company and the forum, visit patreon.com/sealionpress

Cartographicum Thandeum

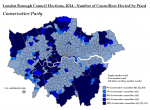
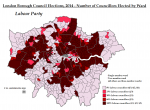
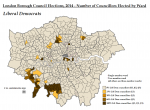
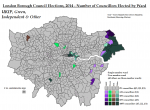
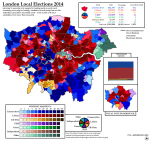
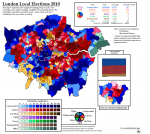
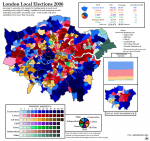
I've been mapping London borough council elections by majority-margin in the wards, but as showing individual councillors elected is hard to do on maps of that scale (due to the multi-member bloc vote wards), I've decided to also do some 2014 maps showing number of councillors by party by ward. Here's the Tories:

London 2014 Concllrs blk.png
 
Fascinating how short a shrift Actual Indos get in London compared to Residents groups of various descriptions.

I'm going to take a wild stab in the dark and say that all of those Green councillors were elected under the description "Nah, don't bother voting for the other two, the Lib Dem candidates are actually really good".
 
Fascinating how short a shrift Actual Indos get in London compared to Residents groups of various descriptions.
Yes; they were more of a thing in the 60s, but true independents almost always gave way to Residents' groups (some of which call themselves Independent Residents, which I am counting as teal other because stop taking the piss).

I'm going to take a wild stab in the dark and say that all of those Green councillors were elected under the description "Nah, don't bother voting for the other two, the Lib Dem candidates are actually really good".
They don't list whether they used the 'first choice' thing in the results I looked at, but probably. They were all elected in wards where the other 2 councillors were Labour, and were never the leading candidate: Camden 3rd, Islington 3rd, Lambeth 2nd, Lewisham 3rd.
 
Yes; they were more of a thing in the 60s, but true independents almost always gave way to Residents' groups (some of which call themselves Independent Residents, which I am counting as teal other because stop taking the piss).

Indos and Residents used to be a lot more common in general I'm finding. Which should be expected really.
 
giphy-downsized.gif
 
It's interesting how colour scales look different on different monitors--on the one I have at home (which is really a TV), the 60% red and blue shades stand out more prominently from the rest than they do on other monitors. Which leads me to notice the interesting point that while Labour had several 60%+ majority wards in 2014, they were in Brent, Ealing or Merton, not where one might naively expect them to be in Inner London.

(The Tories, on the other hand, had all their 60%+ wards in Kensington - in previous years Knightsbridge in Westminster was often also one, but in 2014 a lone Green managed to push them down to 'only' a 59.2% victory margin)
 
Back
Top