I thought I would create a separate thread for this, an idea that came to me yesterday.
People have tried to do wikiboxes before that are Canada as the US or vice versa, of course, but I thought it might be interesting to create a consistent methodology into which one can plug numbers that will spit out hard results. Obviously there's still a lot of handwavium involved, but I thought it was a project worth trying.
The most obvious place to start is to find a way to make numbers equate between the two countries. I don't mean the absolute population (in which the US obviously has nearly ten times Canada's population) but the relative population between units. Canada currently has 13 provinces and territories, although for reasons that should become clear, I am working with the situation in the early 90s, before Nunavut had split off, so we will call it 12 (and we can always just recombine the numbers for the post-1995 Northwest Territories and Nunavut back into one for later elections). The US has fifty states and one district which has a vote in presidential elections. How to make these equate?
I could just try different combinations of states that would equate as closely as possible to the relative population share of a province. For example, Quebec in the 1991 census (the one I am using) had 25.3% of Canada's population, so I could just pick the US states that add up to the closest figure I can get for 25.3% of the USA's population. However, that wouldn't be a very good analogy if it was just random states strewn all over the map. These 'provincial analogies' need to be as analogous as possible, which at a bare minimum means they need to be a coherent lump of states. Ideally, that 'lump' should also be culturally comparable between the corresponding province, or rather, it should play a comparable role in US politics as the Canadian prototype does in Canadian politics. When this analogy is sufficiently strong, I have allowed this to introduce more deviation between the strict percentages. This is most obviously apparent in two cases from the decisions I have made: the 'Left Coast' makes up a bigger proportion of the USA than British Columbia does of Canada (California alone is almost identical to BC's share, but WA and OR really don't fit anywhere else); and New England is the obvious analogue to the Maritimes, but whereas the Maritimes make up 8.6% of Canada (or did in 1991), New England made up only 5.3% of the US. So the Maritime provinces are a tad underrepresented, unfortunately, as I couldn't exactly hack off half of upstate New York and add that in. I did consider making Newfoundland Hawaii instead due to the 'joined later' aspect, but that seemed a bit of a stretch.
So, here are the analogues I have chosen and my reasoning behind them.


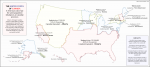
Comparison of share of population of these state combinations in the US (left, 1990 census) and share of population of the original provinces in Canada (right, 1991 census):

My reasoning:
Alberta: I originally looked at making this a slice of the Plains instead, but Alberta makes up such a relatively huge share of Canada that it got ridiculous, stretching from Montana to Oklahoma and beyond. Instead, well, Texas and Alberta are often compared (conservative, cattle, oil, etc.) so I based it on that and added in Kansas for the agrarian side of things. There is no really direct analogue for the Hispanic aspect to the US Southwest in Canada so I have mostly just ignored that, unless you want to make tenuous Métis comparisons.
British Columbia: Obviously culturally analogous to the 'Left Coast', hence the whole 'Cascadia' idea--as noted above, this does mean it got slightly overrepresented in the Canadian-US.
Manitoba: Agrarian Plains farming, mining, and lots of nothing analogous to the northern part of the province. Squeezing Colorado and Utah in are a bit iffy but I don't know where else they'd go.
Newfoundland & Labrador: Maritime. A bit underrepresented, but not much else one could do. Maine's split and Vermont's independent republic are the closest I could get to NL's late addition to Canada.
New Brunswick: Again, a bit underrepresented, but a loose fit.
Northwest Territories: Not really similar geographically, but the significant native element means there is a line that can be drawn.
Nova Scotia: The most significant part of the Maritimes just as MA is the most significant part of New England. Halifax equals Boston here.
Ontario: Overly large and complex, dominant, with the big city everyone else in the province loves to hate (Toronto/NYC). Industrial, the traditional centre of power. Obviously the fact that these states wrap around Ontario itself via the Great Lakes means there is some cultural comparison. There isn't really a huge hinterland like Ontario's north, but the fact that population is tilted towards the east coast loosely resembles the concentration in southern Ontario.
Prince Edward Island: The small island everyone forgets = the other small island everyone forgets.
Quebec: The South is often the analogy for Quebec chosen in these setups, and one can see why, despite the obvious dissimilarities as well. A history of separatism (er, yes), does its own thing, often ends up being politically dominant on a national level despite being in the minority, gets its own way despite theoretically being on the losing side of history (Wolfe vs Grant). It's not quite the same, in that the South exercised its power mostly through Congress and didn't supply as many Presidents as Quebec has Prime Ministers, but you get the idea. This is also a slightly iffy definition of the South to make the numbers work, and it does have the disadvantage that it implies a connection with Texa/Alberta that doesn't exist in the Canadian prototype. In a broader sense, Ontario-Quebec kind of works as an analogy to how the US became independent as a north and south that had an obvious cultural divide from the start but worked together against a common foe, the former's culture was more successful at expanding into the interior than the latter's and the latter ended up feeling like an embattled minority, the latter is more agrarian and has more of a tendency to romanticise a traditional lifestyle, etc. Note also how the capital also straddles the line between them!
Saskatchewan: More agrarian Plains stuff, combined with a political culture that is mostly conservative nowadays but historically flirted with radicalism. (Of course, there was a direct exchange of ideas between Saskatchewan and these states in the past).
Yukon: Another pretty obvious one.
People have tried to do wikiboxes before that are Canada as the US or vice versa, of course, but I thought it might be interesting to create a consistent methodology into which one can plug numbers that will spit out hard results. Obviously there's still a lot of handwavium involved, but I thought it was a project worth trying.
The most obvious place to start is to find a way to make numbers equate between the two countries. I don't mean the absolute population (in which the US obviously has nearly ten times Canada's population) but the relative population between units. Canada currently has 13 provinces and territories, although for reasons that should become clear, I am working with the situation in the early 90s, before Nunavut had split off, so we will call it 12 (and we can always just recombine the numbers for the post-1995 Northwest Territories and Nunavut back into one for later elections). The US has fifty states and one district which has a vote in presidential elections. How to make these equate?
I could just try different combinations of states that would equate as closely as possible to the relative population share of a province. For example, Quebec in the 1991 census (the one I am using) had 25.3% of Canada's population, so I could just pick the US states that add up to the closest figure I can get for 25.3% of the USA's population. However, that wouldn't be a very good analogy if it was just random states strewn all over the map. These 'provincial analogies' need to be as analogous as possible, which at a bare minimum means they need to be a coherent lump of states. Ideally, that 'lump' should also be culturally comparable between the corresponding province, or rather, it should play a comparable role in US politics as the Canadian prototype does in Canadian politics. When this analogy is sufficiently strong, I have allowed this to introduce more deviation between the strict percentages. This is most obviously apparent in two cases from the decisions I have made: the 'Left Coast' makes up a bigger proportion of the USA than British Columbia does of Canada (California alone is almost identical to BC's share, but WA and OR really don't fit anywhere else); and New England is the obvious analogue to the Maritimes, but whereas the Maritimes make up 8.6% of Canada (or did in 1991), New England made up only 5.3% of the US. So the Maritime provinces are a tad underrepresented, unfortunately, as I couldn't exactly hack off half of upstate New York and add that in. I did consider making Newfoundland Hawaii instead due to the 'joined later' aspect, but that seemed a bit of a stretch.
So, here are the analogues I have chosen and my reasoning behind them.
Comparison of share of population of these state combinations in the US (left, 1990 census) and share of population of the original provinces in Canada (right, 1991 census):
My reasoning:
Alberta: I originally looked at making this a slice of the Plains instead, but Alberta makes up such a relatively huge share of Canada that it got ridiculous, stretching from Montana to Oklahoma and beyond. Instead, well, Texas and Alberta are often compared (conservative, cattle, oil, etc.) so I based it on that and added in Kansas for the agrarian side of things. There is no really direct analogue for the Hispanic aspect to the US Southwest in Canada so I have mostly just ignored that, unless you want to make tenuous Métis comparisons.
British Columbia: Obviously culturally analogous to the 'Left Coast', hence the whole 'Cascadia' idea--as noted above, this does mean it got slightly overrepresented in the Canadian-US.
Manitoba: Agrarian Plains farming, mining, and lots of nothing analogous to the northern part of the province. Squeezing Colorado and Utah in are a bit iffy but I don't know where else they'd go.
Newfoundland & Labrador: Maritime. A bit underrepresented, but not much else one could do. Maine's split and Vermont's independent republic are the closest I could get to NL's late addition to Canada.
New Brunswick: Again, a bit underrepresented, but a loose fit.
Northwest Territories: Not really similar geographically, but the significant native element means there is a line that can be drawn.
Nova Scotia: The most significant part of the Maritimes just as MA is the most significant part of New England. Halifax equals Boston here.
Ontario: Overly large and complex, dominant, with the big city everyone else in the province loves to hate (Toronto/NYC). Industrial, the traditional centre of power. Obviously the fact that these states wrap around Ontario itself via the Great Lakes means there is some cultural comparison. There isn't really a huge hinterland like Ontario's north, but the fact that population is tilted towards the east coast loosely resembles the concentration in southern Ontario.
Prince Edward Island: The small island everyone forgets = the other small island everyone forgets.
Quebec: The South is often the analogy for Quebec chosen in these setups, and one can see why, despite the obvious dissimilarities as well. A history of separatism (er, yes), does its own thing, often ends up being politically dominant on a national level despite being in the minority, gets its own way despite theoretically being on the losing side of history (Wolfe vs Grant). It's not quite the same, in that the South exercised its power mostly through Congress and didn't supply as many Presidents as Quebec has Prime Ministers, but you get the idea. This is also a slightly iffy definition of the South to make the numbers work, and it does have the disadvantage that it implies a connection with Texa/Alberta that doesn't exist in the Canadian prototype. In a broader sense, Ontario-Quebec kind of works as an analogy to how the US became independent as a north and south that had an obvious cultural divide from the start but worked together against a common foe, the former's culture was more successful at expanding into the interior than the latter's and the latter ended up feeling like an embattled minority, the latter is more agrarian and has more of a tendency to romanticise a traditional lifestyle, etc. Note also how the capital also straddles the line between them!
Saskatchewan: More agrarian Plains stuff, combined with a political culture that is mostly conservative nowadays but historically flirted with radicalism. (Of course, there was a direct exchange of ideas between Saskatchewan and these states in the past).
Yukon: Another pretty obvious one.