• Hi Guest!

    The costs of running this forum are covered by Sea Lion Press. If you'd like to help support the company and the forum, visit patreon.com/sealionpress

Max's election maps and assorted others

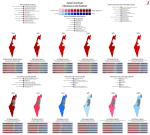
Thailand 2019
val-th-2019.png

Pheu Thai (For Thais) - populist, pro-Shinawatra. The refoundation of the People Power Party, which in turn resulted from the refoundation of the Thai Rak Thai ("Thais Love Thais") Party.
Palang Pracharat (variously translated as "people's power", "citizens' power" or "civil power") - right-wing, pro-military. Effectively the support organisation for the National Council for Peace and Order (NCPO), the military junta that ruled Thailand from 2014 until this election (and still kind of does).
Future Forward Party - centre-left, anti-military. New party for 2019, did better than expected in spite of the, er, dubious circumstances this election was held under.
Democrats - right-wing, royalist, pro-business. Traditionally the main opposition to Shinawatra, seemingly less relevant outside their southern stronghold now that the military's getting into electoral politics on its own.
Bhumjai Thai ("Thai Pride" - no, presumably not that kind) - populist. Largely based in Buriram Province, but polls fairly well across rural north-central Thailand, sometimes well enough to squeak through.
Thai Liberal Party - basically a softer, more centrist version of Future Forward. Won no constituency seats.
Chart Thai Pattana (Save the Thai Nation) - as Bhumjaithai, but with Suphanburi in place of Buriram.
New Economics Party - boy, I wish I knew. Also won no constituency seats.
Prachachart - idfk. EDIT: Very likely a party representing the Muslim Malays of the far south.
Pheu Chart (For the Nation) - Pheu Thai front party, created so the Pheu Thai leadership can jump somewhere if the junta tries to ban their main party. Still won five list seats.
Action Coalition for Thailand - hard-right, royalist, pro-military, pretty questionable on the concept of democracy as such. Right-wing split from the Democrats.
Chart Pattana (Save the Nation) - unclear.
Local Power - pretty much what it says on the tin.
Thai Forest Conservation Party - That's right, a green party in Asia. They seem a bit crap, as they joined the governing coalition after the election, and have repeatedly threatened to pull out over various issues without ever actually doing so.
Someday I may add small parties to the key on the map, today is not that day.
 
That does make wrong-winner results possible in a two-party system - what I mean is a system that beats down bigger parties while giving an advantage to smaller ones.
This was how Uruguay worked during the late 19th and early 20th century - guaranteeing the Blancos a large minority of seats so that they could continue to distribute pork to their clients and not have to do another rebellion for attention. There was at least one election where this denied the President a majority because he couldn't depend on some of the Colorados to vote with him, so some Blancos split off and went into coalition with him. This sparked, you guessed it, another rebellion from the official Blancos.
 
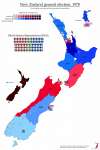
Another thing I noticed doing 1970s NZ elections: the 1972 redistribution's boundaries were used for two elections, in 1972 and 1975, which not only produced a fairly large majority for each of the two big parties, they were exact mirror images of one another in terms of seat totals. In 1972, Labour won 55 seats to National's 32, and in 1975 National won 55 seats to Labour's 32. And those 23 net gains for National were all actual gains, no seat switched against the wind and no third parties won any seats in either election. With that in mind, it's quite easy to paint a picture of which areas in 1970s New Zealand were safe for Labour, which ones were safe for National and which ones were marginal.

val-nz-1972-75.png

Now, a lot of this would shift in the 1980s, as Wellington in particular became much redder while rural New Zealand moved to National. There may well be value to doing a similar comparison for the 1987 redistribution, which also lasted two elections and saw a very similar swing between the two.
 
Now, a lot of this would shift in the 1980s, as Wellington in particular became much redder while rural New Zealand moved to National. There may well be value to doing a similar comparison for the 1987 redistribution, which also lasted two elections and saw a very similar swing between the two.
Here we are. Worth noting that this set of elections was much more uneven - 1987 was a fairly standard Labour majority everywhere but Auckland, whereas 1990 was the most lopsided National landslide since the birth of the party and the worst Labour result since 1931. Also, Sydenham was held by Jim Anderton even after he left Labour, but if he'd stayed in it would 100% have been a Labour hold even under these circumstances.

val-nz-1987-90.png
 
Back
Top