• Hi Guest!

    The costs of running this forum are covered by Sea Lion Press. If you'd like to help support the company and the forum, visit patreon.com/sealionpress

Nanwe's Maps and Graphics Thread

I suppose to scale it to the present day it would probably be a case of looking at the previous couple of censuses to see if there were some significant trends going on in the ethnic balance.
 
I suppose to scale it to the present day it would probably be a case of looking at the previous couple of censuses to see if there were some significant trends going on in the ethnic balance.

Yes, I can already tell you that the Serbian minority in Croatia went from 13% in 1991 down to 2% in 2011. Then in Bosnia, people moved around a lot, for obvious reasons (Sarajevo went from an ethnically mixed city to a Bosniak-dominated one) according to the truce lined, who have mark the internal Bosnian border. Funnily enough though, the population balance overall barely shifted.
 
Yes, I can already tell you that the Serbian minority in Croatia went from 13% in 1991 down to 2% in 2011. Then in Bosnia, people moved around a lot, for obvious reasons (Sarajevo went from an ethnically mixed city to a Bosniak-dominated one) according to the truce lined, who have mark the internal Bosnian border. Funnily enough though, the population balance overall barely shifted.

I was thinking more along the lines of 'the 1971 and 1981 censuses show the municipality was slowly becoming more Serb dominated, and then the wars fucked this up and it's super-majority Croat (and significantly depopulated)' as an example of what you'd be trying to extrapolate from.
 
I was thinking more along the lines of 'the 1971 and 1981 censuses show the municipality was slowly becoming more Serb dominated, and then the wars fucked this up and it's super-majority Croat (and significantly depopulated)' as an example of what you'd be trying to extrapolate from.

That should be fairly doable yes. I think the main difference between 1981 and 1991 is that the number of people who self-identified as 'Yugoslavs' halved. But if I could find the data for 1981 that would be interesting to look into. Also, did you know there are/were two Slovak-majority municipalities in Vojvodina?
 
That should be fairly doable yes. I think the main difference between 1981 and 1991 is that the number of people who self-identified as 'Yugoslavs' halved. But if I could find the data for 1981 that would be interesting to look into. Also, did you know there are/were two Slovak-majority municipalities in Vojvodina?

Doesn't surprise me- that place had all the Habsburg-sponsored colonists dumped into it and was pretty quiet in the 90s after all.
 
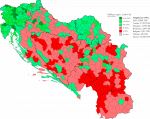
1991 Yugoslavia - ethnicity by municipality
Huge image here: https://www.deviantart.com/nanwe01/art/Yugoslavia-in-1991-783039381

This map shows the ethnic majority group and their share of the population in each municipality of Yugoslavia according to the 1991 census. I believe that the numbers of Kosovo are more of an estimation than a proper census due to the political difficulties involved in the Serbian Socialist Republic's census-making in the autonomous republic.

Notice: The ethnic geography of Bosnia and Herzegovina or the presence of a large Serb minority in Croatia (12% of the national pop.). The lower percentages in Istria is not due to Italians (except in two municipalities' cases) but rather due to many people identifying not as Croat but as 'regional identity'.

'Grad' [city]' is an odd thing of Socialist Yugoslavia, where the larger cities in the country were split into various municipalities but still also had some common major 'city' government that included a good chunk of their metropolitan areas. This set up only continues to exist in the case of Grad Beograd (aka. Belgrade).

Another thing that is very evident from this map is that Croatia and Slovenia, post-independence, divided their Titoist-era municipalities into smaller ones. In the Croat case, many many smaller ones.

I've posted it in DeviantArt, which means soon I'll have the ethnic hatred brigade coming to criticise this and that.


1991_Municipal_demographics_map.png
 
Last edited:
1991 Yugoslavia - GDP per capita per municipality
And now, the per capita wealth of each municipality in which the national Yugoslav GDP per capita equals 100.

The regional economic disparities by the end of the 1980s were very considerable. In terms of numbers, the Ljubljana number GDP per capita index was 260, in Rijeka, 213. The poorest large cities were Pristina in the AP Kosovo at 70 and Titograd (Podgorica, Montenegro) at 87.

Also, the Austro-Hungarian/Venetian-Ottoman boundaries of the past are easy to spot.

Yugoslavia_wealth_per_municipality_1990.png
 
Last edited:
ATL: 1991 Yugoslav electoral map (mk1)
The electoral constituencies of the alt-election of 1991 in Yugoslavia (part of an AH project I'm just starting). These are the constituencies to the Federal Chamber (lower house) of the Federal Assembly of Yugoslavia. It is formed by 300 deputies elected from 32 constituencies through closed-list proportional representation, employing the D'Hont method. The threshold would be 3% with an exception for minority lists (e.g. Vlachs in Zajecar, Muslims in Kraljevo).

All republics with the exception of Montenegro are divided into several constituencies, from 2 in Slovenia to 9 in Serbia proper (14 if you add the APs). No constituency elected less than 4 members nor more than 14, the average size was 9.38 MPs per constituency, the median was 9. One MP per 78,558 citizens (no electoral register to work with).

Republic of Serbia: 124 seats (41.33%)
- Serbia Proper: 74 seats (24.67%)
- AP Kosovo: 25 seats (8.33%)
- AP Vojvodina: 25 seats (8.33%)
Republic of Croatia: 61 seats (20.33%)
Republic of Bosnia and Herzegovina: 56 seats (18.67%)
Republic of Macedonia: 26 seats (8.67%)
Republic of Slovenia: 25 seats (8.33 %)
Republic of Montenegro: 8 seats (2.67%)


1991_yugoslav_constituencies_map.png
 
Last edited:
OTL: 2014 Brussels regional election
Back to our regularly scheduled Belgian madness. The Brussels Parliament 2014 election. Due to one of those funny quirks of Belgium, as a bilingual region, Brussels has to have an evenly-balanced executive even though the disparity between the number of Francophones and Dutch-speakers in the city and the Brussels Parliament is so huge.

This means that out of 17 Dutch-speaking MPs, there are 2 (out of 4 ministers + 1 Minister-President) that are Dutch speakers. Compare this to the 2 Francophone ministers (+1 Minister-President) out of 72 Francophone MPs.


8IR237M.png
 
OTL: 2014 Germanophone Community election
This is the map for the 2014 election of the German-speaking Community Parliament. The election was fought between two Christian democratic parties, the CSP (the German-speaking branch of the Francophone cdH) and the unaffiliated ProDG. Typical German-speaking microstate stuff. After the election, ProDG formed a government with SP (German-speaking branch of the PS) and the liberal PFF (the German-speaking branch of the MR and only Belgian liberal party to retain the party's pre-split name). The ProDG has one minister (plus the Minister-President) and the SP and the PFF have one minister each as well.

tIoLSdK.png
You know how to tickle my heart.

We were discussing the Strange Survival of Vivant Belgium (and their policies, er, diverging somewhat from the mother party these days) elsewhere a while back as it happens.
 
Columbia: Modern political parties
[PS: I swear this is not my attempt at doing the latest American Dominion thing, but it draws from that. I was thinking of using SNTV as the electoral system because why not]

Political Parties in Columbia

Like in several other Anglophone countries (but markedly not the United Kingdom), the Columbian political cleavage is not clear-cut based on class. While the socio-economic, left-right axis matters a great deal, demographics are extremely important. And more than demographics, almost history matters as much, at least on the right: The losers of the Federalist Rebellion vs. its winners. West of the Ohio River, the People's Party is the main centre-right force, east of it, the National Progressive Party.

Columbia's old industrial working classes - mostly gone nowadays as a concept - were made up of recent arrivals, ethnic Columbians (Hiberno- and Italo-Columbians primarily), alienated from the Mayflower families [1] that dominated the NPP, who voted Labor. As a result, to this day, Labor draws primarily from the working class (now formed by recent arrivals) and 'white ethnic' Columbians who tend to be solidly middle-class. In western Columbia, where the PEC [2] Trinity and the number of Anglo-Columbians was reduced, politics evolved differently. Labor exists, and it's powerful in the main cities and in the mining valleys of the Appalachia, but there is a strong, Christian left, drawing from evangelical traditions and which drew support from Germano-Columbians and especially Nordic Columbians.

All this has contributed to the country's fractious politics, especially with the rise of the new left parties. Amidst all this, Columbian parties are not known for their ability to control their members, resulting in strong factionalism and parliamentary instability.

National Progressive Party: The party of the traditional upper classes of the country, economically centre-right and socially moderate (liberal-conservative or conservative liberal in European parlance), it is strong in rural New England, the Maritime Provinces, Upstate New York (OOC: Need a proper TTL name for this) and Pennsylvania. It also draws support from middle- and upper-middle urban people from eastern Columbia, and the well-off west of the Ohio River.

Laborers' Party (Labor): Labor is the party of the trade unions, ethnic Columbians and the urban working class. It is the only major party that is able to draw significant support from both east and west Columbia. In eastern Columbia too, the party also receives the votes of the rural left.

Independents' League: A result of Columbia's long-standing love for independent, centrist candidates, the League is openly non-ideological and proudly unwhipped. As a result, it is home to a plethora of political views, but its support in suburbs and exurbs, as well as from the Jewish community means that most of the League's affiliated MPs are centrists or liberals.

People's Party: The party of the western right. Unlike the more secular NPP, the People's Party has stronger ties to religious organisations, drawing significant support from evangelical Christians. As a result, it's economically centrist but socially the most conservative party. It is also a supporter of stronger provincial autonomy, in the spirit of the Federalist Rebellion. Ethnically-speaking, it draws support from the rural middle class and in the cities from conservative Germano-Columbians and also a good chunk of the Anglo-Columbian and Scots vote.

Farmers’ Union: The Union is the smallest of the major parties, as it represents a weakening brand of politics - Rural left-wing radicalism. Heavily tied to the land reform and cooperative movement that was very strong during the first half of the 20th century, the party has constantly lost support over time and now it exists almost more a vehicle for Nordic Columbians and left-leaning Germano-Columbians. Its left-wing stance combined with ties with evangelical Christianity has made it the main voice of Afro-Columbians in major cities like Chicago or Richmond (OTL Detroit-Windsor).

Green Party: Founded in the 1970s, it's explicitly a brand of post-ethnic, post-materialist politics. A niche party, it is mostly supported by students and very left-wing people, given the party's eco-socialist stances.

Green Liberal Party: Created in 2011 as a splinter from the Green Party, the GLP brings together ecological politics with free-trade support and liberal economics. As a result, it draws its votes from yuppies. This means that while small, it is over-represented in major cities like New York, Philadelphia or Boston.

[1] Trying something different as a terminology for WASP.
[2] Presbyterian-Episcopalian-Congregationalist, again trying out terminology other than 'WASP'.
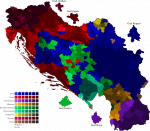
 
The only election in the modern history of Spain where a Carlist got elected (mind you an ideologically Titoist Carlist party) and will require its own shading as they came first in at least two municipalities. It's the Foral Parliament election of 1979, held together with the elections for the Juntas Generales of Biscay, Guipuzcoa (by direct suffrage) and Alava (by indirect election through local councillors) and the first Spanish local elections.

The 1979 election was the only one to use the merindades (the medieval Navarrese subdivision) as constituencies. As per your usual Spanish practice, each merindad was assigned 5 seats regardless of population and the remaining seats were distributed according to population until allocating all remaining 40 seats to add up to 70.

There's going to be a lot of shading because there were loads of small left-wing parties and coalitions that won at least one municipality somewhere. So far I've only mapped the more homogeneously Spanish-speaking southern part of Navarra, where not so coincidentally the largest party where the UCD (green), the PSOE (red) and the foralist but anti-Basquist UPN (blue). Only Olite and Tudela are finished (the blank area is a facería). Facerías are an essentially uninhabited territory that for whatever reason in Navarra are governed separately from the regular municipalities.

Fun fact: The term 'merindad' comes from 'merino' a royal official named by the King of Navarra. It's no longer fun because a merino was also a Castillian royal official charged with supervising and regulating sheep raising and wool trade, but apparently, there's no relationship between both terms, besides coming from the same Latin term, maiorinus.


HD1GhdJ.png
 
Facerías are an essentially uninhabited territory that for whatever reason in Navarra are governed separately from the regular municipalities.

I imagine its for similar reasons to the old 'extra-parochial areas' we had. Basically if the area was uninhabited, held in common or had some special resource (such as woodlands or fenlands) it was generally held to be better that it wasn't given to any particular parish.

Of course this also ended up applying to hospitals, cathedral closes, the Inns of the Court etc.
 
Back
Top