• Hi Guest!

    The costs of running this forum are covered by Sea Lion Press. If you'd like to help support the company and the forum, visit patreon.com/sealionpress

Cartographicum Thandeum

I don't know why, but I have a fondness for wikiboxes where the change to OTL is basically just adding up OTL countries and see how the rankings change. If all of Ireland was still part of the UK, we'd leapfrog Poland on the area stakes and Brazil on one measure of GDP (surprisingly).

Note: I've not edited the Gini coefficient and HDI because I didn't know how to calculate those - @AndyC ?

1553269789215.png
 
I don't know why, but I have a fondness for wikiboxes where the change to OTL is basically just adding up OTL countries and see how the rankings change. If all of Ireland was still part of the UK, we'd leapfrog Poland on the area stakes and Brazil on one measure of GDP (surprisingly).

Note: I've not edited the Gini coefficient and HDI because I didn't know how to calculate those - @AndyC ?

View attachment 9575

There is something I feel is truly sad from the fact that the picture they use on the actual Wiki for the UK, namely this one, has Britain be slightly to the upper left of the centre, because it is traced from another picture showing where Germany is on the globe, and so has Germany at the centre.
 
There is something I feel is truly sad from the fact that the picture they use on the actual Wiki for the UK, namely this one, has Britain be slightly to the upper left of the centre, because it is traced from another picture showing where Germany is on the globe, and so has Germany at the centre.
This is why we voted etc. etc.
 
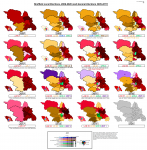
And here's a map of Cambridge. The popular vote is closer between Labour and the Lib Dems than it's been for a while, but the latter seem to have fought a cautious campaign after being unexpectedly burned in 2018 in Trumpington. The Greens have lost their last seat to the Lib Dems, though they retain a decent voteshare across the city. Part of the reason why Labour are so unchallenged in the east is that the Lib Dems and Greens are still jockeying for position as the main opposition, something I've seen myself in Sheffield.

Also, Cambridge seems to have a lot of double vacancies. It reminds me of Newcastle and its worrying number of 'delayed by candidate death' by-elections which makes one wonder if there is a very specific Geordie local government serial killer on the loose.

1556970074279.png
 
I don't know why, but I have a fondness for wikiboxes where the change to OTL is basically just adding up OTL countries and see how the rankings change. If all of Ireland was still part of the UK, we'd leapfrog Poland on the area stakes and Brazil on one measure of GDP (surprisingly).

Note: I've not edited the Gini coefficient and HDI because I didn't know how to calculate those - @AndyC ?

View attachment 9575

If it was a random ah.com wikibox it would have just one different like driving side being on the right or something.
 
Doing some more council maps and thought I'd do Barnsley for @Lord Roem .

1557399260234.png

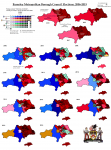
This is a classic South Yorkshire "We are upset with Labour but not quite willing to vote for anyone else in a coherent way" election (see: Doncaster 2004). Comedy turnout even by South Yorks standards mind you so don't read too much into this. The Notorious BIG are not quite dead, the Donkeys & Veterans of all people got two seats (they have been building up for a while), two independents arrived (I think out of nowhere but not sure) and even the Lib Dems have got into the action, presumably by fitting all their activists with electronic tags that give off powerful electric shocks if any of them say the word 'Brexit'.

'Other' and independents are well ahead of any other alternative in the popular vote here, 'Other' taking in D&V, the Yorkshire Party, the BIG, the English Democrats (yes, they still exist) and the Socialist Alternative (ditto). Even the Greens did surprisingly well in a couple of wards.

1557399486536.png
 
Decided to work on a map of Leeds for @Kvasir , and--what the chuff happened to Wikipedia? I've already noticed that a lot of their council election pages have got better in general, but look at Leeds 2018, I've seen national elections without that level of coverage. They even calculate percentages and majorities for bloc vote in the proper way--well, nearly, it's subtly different, I think perhaps they count spoilt ballots as part of the total? Well, close enough for government work.

I'm not sure whether it's @Skinny87 or Look North that's to blame for this.

Also I like how Leeds had all-ups in 2018 due to boundary changes yet the boundary changes were stupidly minor, makes one wonder why they bothered. Trying to fit in all the little mans (I've decided to use a new design inspired by @Uhura's Mazda --er, his graphical design, not his own physique--from now on where possible) into the wards made me realise why Iain goes on about Leeds' number of councillors vs Birmingham's so much now.

(Map upcoming when I finish 2019)
 
And here's that Leeds map.

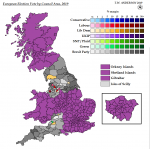
2019 not terribly dramatic here for the most part. I had missed that story about loads of Labour councillors quitting the party around 2017 and forming their own independent groups (with blackjack and hookers), though none of them have managed to hold/win seats except the Garforth & Swillington lot--who look to be well on their way to being another Morley.

1557439819720.png
 
Last edited:
Decided to work on a map of Leeds for @Kvasir , and--what the chuff happened to Wikipedia? I've already noticed that a lot of their council election pages have got better in general, but look at Leeds 2018, I've seen national elections without that level of coverage. They even calculate percentages and majorities for bloc vote in the proper way--well, nearly, it's subtly different, I think perhaps they count spoilt ballots as part of the total? Well, close enough for government work.

I'm not sure whether it's @Skinny87 or Look North that's to blame for this.

Also I like how Leeds had all-ups in 2018 due to boundary changes yet the boundary changes were stupidly minor, makes one wonder why they bothered. Trying to fit in all the little mans (I've decided to use a new design inspired by @Uhura's Mazda --er, his graphical design, not his own physique--from now on where possible) into the wards made me realise why Iain goes on about Leeds' number of councillors vs Birmingham's so much now.

(Map upcoming when I finish 2019)
I too have noticed that Leeds local election Wikipedia is very very good right now. Consider that every ward has its own page and electoral history, for example: https://en.wikipedia.org/wiki/Kirkstall_(ward)

Now as for the all ups. The reason we desperately needed to shift the boundaries was because of green belt. Basically. So Leeds has a fair amount of brownfield sites in the centre of the city and an outer city area strongly protected by planning laws. And the council has been desperate to build more housing because the situation is pretty dire. So we've seen a lot of rather dense building occurring in the centre, and some housing has been removed because it wasn't fit for purpose and will be rebuilt. So the centre wards in Leeds were completely out of whack. Meanwhile the outer wards all saw very modest house building quite evenly spread. This allows them to remain unchanged.

The centre wards overtook the rest of the city necessitating a full redraw. But, when the wards were redrawn in 2004 all the political parties agreed it was a vast improvement on what came before in terms of communities. There are some minor grapes that come down to sizing issues, for example parts of Horsforth. But there is a general consensus in the city that no party is trying to screw over any other party. We also have a pretty bad councillor to electorate ratio, so lowing it from 99 was unpalatable. If anything we need more councillors not less but we asked to keep it as is and the commission thankfully agreed.

Depending on how these court challenges square up though, the seats may have to be changed again sooner than we'd like but we will need to see.

In regards to the creation of a slew of independents, the map is misleading. They are all from the same source. Councillor Mark Dobson, the executive in charge of bins, from Garforth and Swillington, fell out with the rest of the executive board and picked up his ball and walked home. He took with him the people who were 'his', including his sister and his partner, and a ward colleague. He wanted to use his brand as ward member for Garforth and Swillington to his advantage. His girlfriend and sister however ran on a more generic label. Janette Walker for example was originally a councillor in Headingley and didn't have as much connection. They tried to unite the anti-Labour vote around them while previously been Labour councillors. However Mark Dobson was a household name in the area. He attacked the council for council tax increases and cutting services (even though he understood the financial situation) and played the NIMBY card. Combined with council tax relief and a "Garforth is special and not Leeds" stragegy he was able to crush Labour in the ward.

The whole thing was a bit of a shit show if I'm being honest.
 
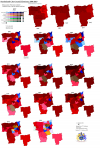
Newcastle-upon-Tyne ( @Elektronaut , @Geordie ) has a pattern a bit different to some other Lab vs Lib cities like Sheffield, Hull or Cambridge; the Lib Dems lost big in 2011, seemed to have worked out a winning strategy of damage limitation in 2012 and 2014, then got clobbered in 2015 on the general election turnout and reeled for quite a bit. In the most recent elections they managed to get back some of the wards they were holding onto in 2012-14 like Ouseburn and North Jesmond, but they're still too coalition-burnt in the west of the city to realistically challenge for a majority as they did in the Blair years. Instead opposition to Labour is coming from other groups; if I lived in Newcastle I would be full two-buttons-meme due to the fact that the most successful of these have ridiculous names like "It's Time To Put Newcastle First" and even (a near miss) "Local Community Candidate". Not sure if the first one is the same Newcastle First that was going to merge with UKIP and then didn't a few years ago. UKIP and the Greens both had a few decent second places but nothing special, and there's a UPLB independent machine in Chapel ward.

Incidentally--and @iainbhx will probably call me a little baby for not knowing this was the norm--I calculated turnouts and was surprised at how much variation there is between wards (and these are new wards as of 2018) in terms of electorate. IIRC wards are drawn based on population rather than electorate, but there must be a ton of people ineligible to vote due to age or other reasons in some wards--there's a range from 4,439 to 8,681 from the ward with the smallest to the biggest electorate, and they all get three councillors...

1557493667154.png
 
Because the LGBC unlike the Westminster Boundary Commission has a set of rules that take into account “future growth” of population.?
Ah, hadn't thought of that--that would make sense then. Perhaps might also explain some of the peculiar behaviour of Sheffield's new City ward as that was explicitly put in place in reflection of population growth, although that's mostly just students and immigrants leading to comedy turnouts I think.
 
Back
Top